How to Avoid Overfitting Your Trading Backtests

You avoid overfitting by limiting parameter sweeps, logging every trial as N_trials, requiring a minimum backtest length (MinBTL) matched to that count, and validating with PBO, Deflated Sharpe (DSR), PSR, and CPCV or walk-forward before a single dollar goes live.
Three things to do right now in TradingView:
- Cap your parameter grid at a few core inputs and freeze everything else before you run a single backtest.
- Open a spreadsheet and log every configuration you test. That count is your N_trials, and you need it to compute DSR and PBO later.
- Reserve the last portion of your data as a forward-test period. Touch it once, at the end, and never retune after.
Pro Tip: Set your TradingView strategy’s date range to exclude the final quarter of data before you touch any parameters. That boundary is your sequestration line — crossing it resets your trial count.
Key Takeaways
Avoiding overfitting in trading backtests requires logging N_trials, matching MinBTL to that count, passing DSR and PBO thresholds, and completing walk-forward or CPCV validation before any live deployment.
| Point | Details |
|---|---|
| Log every trial as N_trials | DSR, PBO, and expected-max-Sharpe are uncomputable without an accurate trial count. |
| Match MinBTL to N_trials | 100+ trials requires 5+ years of data and 300+ trades to meet minimum length requirements. |
| DSR and PBO thresholds | Target DSR above 0.95 and PBO below 0.5 before advancing to walk-forward validation. |
| Walk-forward or CPCV before live | Run multi-fold OOS validation with an embargo gap; a steep IS→OOS degradation slope is a stop signal. |
| Big Move Algo | Built-in Fake Trend Detector and minimal AUTO Mode parameters reduce curve-fitting risk from the indicator side. |
Table of Contents
- 1. What curve-fitting means for backtests and why it kills live performance
- 2. Why a simple train/test split usually fails to prevent overfitting
- 3. Minimum backtest length and capping your trial count
- 4. Statistical diagnostics that detect selection bias
- 5. Walk-forward, CPCV, and forward testing: how to run each one
- 6. A practical TradingView workflow to prevent curve-fitting
- 7. Red flags that tell you a backtest is curve-fitted
- 8. A worked decision flow you can copy
- 9. The real lesson most traders miss about overfitting
- Big Move Algo gives you signals built to survive out-of-sample
- Sources
1. What curve-fitting means for backtests and why it kills live performance
Curve-fitting (the formal term is backtest overfitting) happens when you tune an indicator or strategy to historical noise until it looks great on past data but has no predictive power going forward. The strategy has memorized the past rather than learned from it.
The mechanism is multiple-testing bias. Every time you test a new parameter combination, you run another implicit hypothesis. Bailey et al. show that with enough trials you can fit any desired in-sample Sharpe Ratio to almost any dataset — the result reflects selection luck, not edge. When financial series carry autocorrelation, a curve-fitted strategy can produce systematically negative out-of-sample returns, not just random underperformance.
A concrete example: suppose you sweep moving-average lengths from 5 to 200 bars across 10 symbols. That is potentially thousands of combinations. The top-ranked result will show a high in-sample Sharpe almost by construction. Put it live and the edge evaporates because the “signal” was noise the optimizer happened to fit.
- More trials = higher expected maximum in-sample Sharpe, regardless of real edge.
- The gap between in-sample and out-of-sample performance widens as N_trials grows.
- Regime shifts can invert a curve-fitted strategy’s sign entirely in live markets.
The Interactive Brokers curve-fitting webinar frames this well for retail traders. Limiting parameter optimization and including realistic execution costs are the two most accessible defenses available before you ever touch a statistical diagnostic.
2. Why a simple train/test split usually fails to prevent overfitting
A single hold-out split feels rigorous. The problem is what happens before you look at that OOS set.
If you ran 50 parameter combinations, rejected them, and then checked the hold-out on the 51st, you have implicitly tested 51 hypotheses on that OOS set. TrustedQuant’s analysis makes this explicit: hold-out does not account for N_trials, so repeated searching followed by a single OOS check can produce false confidence just as reliably as no hold-out at all.
Regime shifts compound the problem. A hold-out period that happened to be a trending market will validate a trend-following strategy even if that strategy is completely curve-fitted to the in-sample trend. The OOS “confirmation” is an artifact of regime alignment, not robustness.
- Hold-out ignores how many searches preceded the final test.
- Re-testing on the same OOS set after further tuning is implicit multiple testing.
- A single regime in the hold-out period can produce a false positive.
Pro Tip: Treat your OOS set like a sealed envelope. Log every time you peek at it. If you peek more than once after retuning, your OOS is no longer out-of-sample — it is another in-sample period.
3. Minimum backtest length and capping your trial count
The MinBTL concept answers a direct question: given how many configurations you tested, how long does your backtest need to be before the result is statistically meaningful? The answer grows with N_trials.
| N_trials | Suggested MinBTL | Minimum trade count | Expected IS→OOS Sharpe gap |
|---|---|---|---|
| 10–25 | 2 years | 100 trades | Small |
| 25–100 | 3–4 years | 200 trades | Moderate |
| 100+ | 5+ years | 300+ trades | Large |
| 500+ | 7+ years | 500+ trades | Very large |
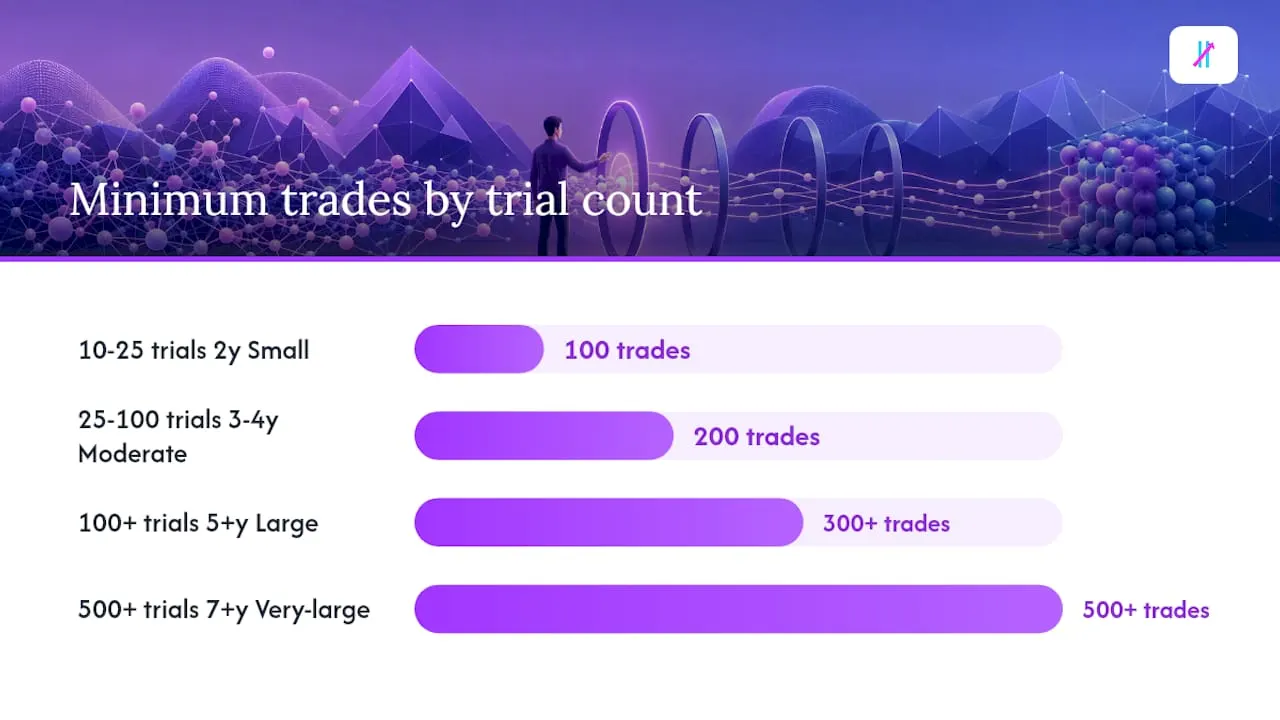
These ranges reflect the logic in Bailey et al.'s MinBTL framework: as N_trials doubles, the expected maximum in-sample Sharpe rises, and you need proportionally more data to distinguish genuine edge from selection luck. For most retail traders on TradingView, a 2-year daily-bar dataset with 25 or fewer trials is a realistic starting point. Pushing to hundreds of trials on 2 years of data greatly increases the risk of a curve-fitted result.
Industry guidance from practitioners suggests keeping your optimization to a few core parameters and freezing the rest before testing begins. Every additional free parameter multiplies your effective trial count.
Pro Tip: Before you run any sweep, write down the exact parameters you will test and their ranges. That list defines your N_trials ceiling. Staying disciplined about that list is the single cheapest overfitting control available.
4. Statistical diagnostics that detect selection bias
These five diagnostics give you a number to put next to your backtest result. None of them replace good data hygiene, but each one catches a different failure mode.
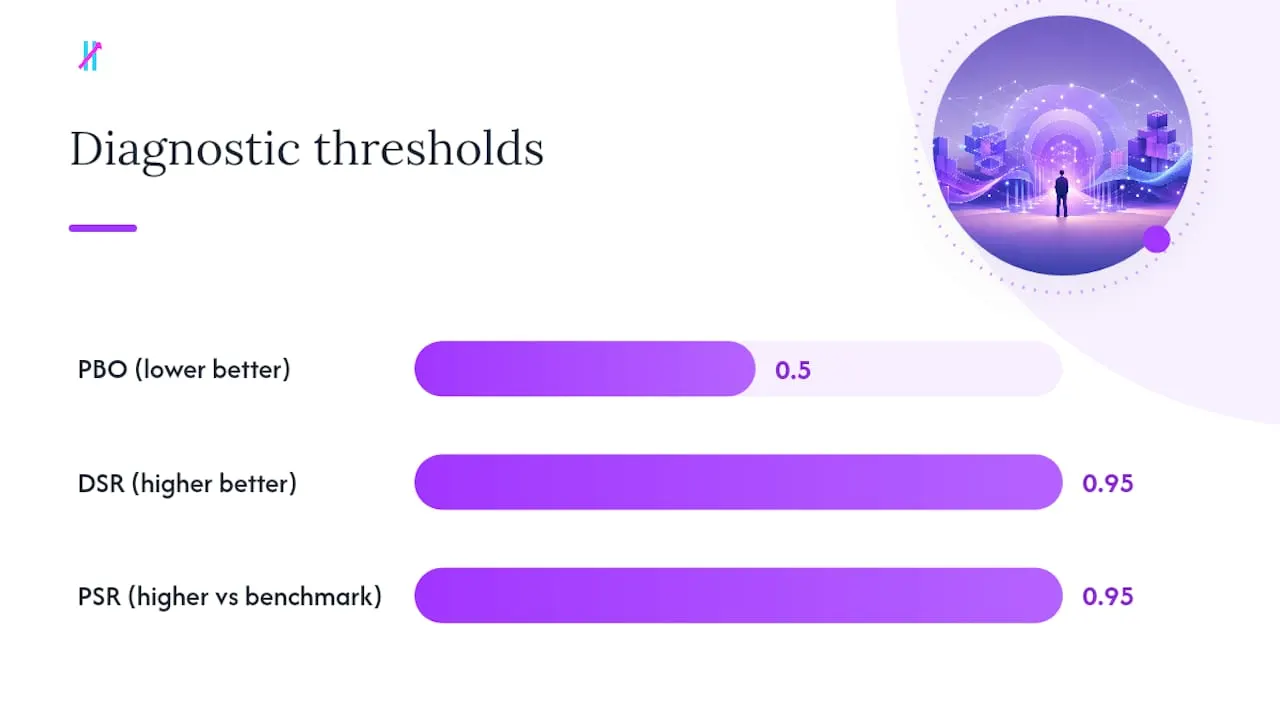
- Probability of Backtest Overfitting (PBO): Introduced by Bailey, Borwein, López de Prado, and Zhu, PBO estimates the probability that the selected strategy is the product of selection rather than genuine skill. Lower is better; a PBO above 0.5 means you are more likely overfit than not.
- Deflated Sharpe Ratio (DSR): Adjusts the observed Sharpe for the number of trials, non-normality of returns, and length of the backtest. A DSR above 0.95 is a useful working threshold, though it is sensitive to sample size. Requires you to report N_trials.
- Probabilistic Sharpe Ratio (PSR): Answers the question “what is the probability that the true Sharpe exceeds a benchmark?” without the multiple-testing adjustment. Use it as a first pass before applying the DSR haircut.
- Expected-max-Sharpe: The Sharpe you would expect to find by chance given N_trials and the return distribution. If your observed Sharpe is at or below this baseline, there is no evidence of edge.
- Harvey-Liu multiple-testing haircut: Applies a penalty to the observed Sharpe proportional to the number of strategies tested. The oos-lab toolkit implements this alongside DSR, PSR, and PBO so you do not have to build the math from scratch.
Always report N_trials alongside any diagnostic result. Without that count, DSR and expected-max-Sharpe are uncomputable, and PBO loses its calibration.
| Diagnostic | What it catches | Threshold guidance |
|---|---|---|
| PBO | Selection bias across splits | Below 0.5; lower is better |
| DSR | Multiple-testing inflation | Above 0.95 preferred |
| PSR | Low-confidence Sharpe | Above 0.95 vs benchmark |
| Harvey-Liu haircut | False discovery from search | Positive adjusted Sharpe |
5. Walk-forward, CPCV, and forward testing: how to run each one
- Anchored walk-forward: Fix the start of your training window and expand it forward in 3–6 month increments. Test on the next unseen period after each expansion. Average the OOS metrics across all folds. This simulates how a live trader would periodically reoptimize.
- Rolling walk-forward: Slide both the training and test windows forward together. Better for detecting regime sensitivity because no single period dominates the training set.
- Combinatorial Purged Cross-Validation (CPCV) with embargo: Described by López de Prado (2018) and implemented in oos-lab, CPCV generates many train/test splits from combinatorial subsets of the data, adds an embargo gap between training and test to prevent leakage from autocorrelated returns, and uses the results to estimate PBO directly. It extracts far more information from a limited dataset than a single hold-out.
- Forward (paper/live) testing with model sequestration: Before you go live, announce your exact parameter set in writing, timestamp it, and paper-trade for at least 30–60 trades without touching the parameters. This is the only test that cannot be contaminated by look-ahead.
Pro Tip: Set a fixed random seed in stochastic parts of your strategy and log it with N_trials. Reproducibility enables auditing and ensures diagnostics are reliable.
6. A practical TradingView workflow to prevent curve-fitting
Before you open the strategy tester:
- Write down your hypothesis and the 2–5 parameters you will test, with explicit ranges.
- Set the date range to exclude your reserved forward-test period (the final 20–30% of available bars).
- Embed realistic commission and slippage in the strategy settings — at minimum, round-trip commission plus one tick of slippage per trade.
During testing:
- Log every combination you run in a spreadsheet: parameter values, in-sample Sharpe, max drawdown, trade count. Each row is one trial toward your N_trials total.
- Stop when you hit your pre-defined trial cap. Do not add parameters because the first sweep looked weak.
- Use TradingView’s bar-replay feature with a frozen right edge to simulate forward-bar-by-bar execution on the reserved period.
Before going live:
- Compute DSR and PSR using your logged N_trials and the oos-lab toolkit. If DSR falls below 0.95, the strategy does not pass.
- Run walk-forward or CPCV on the in-sample period. Check that OOS metrics across folds do not degrade sharply relative to in-sample.
- Paper-trade for 30–60 trades minimum. Log every signal and result without retuning.
Pro Tip: Test across at least 2–3 uncorrelated instruments before committing. A strategy that works only on one symbol in one time period is almost certainly curve-fitted to that symbol’s specific price history. Simpler signals tend to generalize better — see how fewer parameters reduce noise.
- Aim for at least 100 trades in-sample, preferably more depending on strategy frequency. Testing across multiple instruments helps reveal specific overfitting. Incorporate realistic slippage assumptions especially for frequent trading.
7. Red flags that tell you a backtest is curve-fitted
Stop and revalidate before deploying if you see any of these:
- Near-perfect equity curve with almost no drawdowns in-sample. Real edges have rough patches.
- Fewer than 100 trades in the backtest. Statistical significance requires sample size.
- More than 4–5 tuned parameters. Each free parameter multiplies effective N_trials.
- Sharp IS→OOS degradation where in-sample Sharpe is 2.0+ but OOS Sharpe drops below 0.5.
- Strategy works on only one instrument or one calendar period. Regime dependence, not edge.
- No slippage or commission in the backtest. Any strategy that requires perfect fills to be profitable is not profitable.
- You cannot reproduce the exact backtest result from a documented parameter set and seed.
Pro Tip: If your backtest equity curve looks better than any fund you have ever seen, that is the red flag. Genuine edges are modest and consistent, not parabolic. Review common beginner mistakes that produce exactly these misleading curves.
8. A worked decision flow you can copy
Here is a compact example using a moving-average crossover on a daily equity chart.
- Define the grid: fast MA (5–50 bars, step 5), slow MA (20–200 bars, step 10). That is 10 × 19 = 190 combinations. N_trials = 190.
- Check MinBTL: With N_trials = 190, the MinBTL framework requires roughly 5 years of daily data and at least 300 trades. Confirm your dataset meets both before proceeding.
- Run in-sample sweep on years 1–4. Log every combination. Best result: fast = 15, slow = 60, in-sample Sharpe = 1.8.
- Compute expected-max-Sharpe for N_trials = 190. If the expected maximum by chance is 1.6, your observed 1.8 is only marginally above the noise floor — weak evidence of edge.
- Compute DSR using N_trials = 190, observed Sharpe = 1.8, and return distribution stats. If DSR = 0.72, the strategy fails the threshold. Do not proceed to live.
- If DSR passes (> 0.95): run walk-forward across years 1–4 in 6-month folds. If average OOS Sharpe across folds is above 0.8 and the performance-degradation slope is not steep, proceed to paper trading.
- Paper-trade year 5 with frozen parameters. After 50 trades, compare live Sharpe to walk-forward OOS average. A modest shortfall (10–20%) is normal. A shortfall above 50% warrants stopping and investigating regime change before scaling.
Go/no-go criteria:
- DSR > 0.95 AND PBO < 0.5 AND walk-forward OOS Sharpe > 0.6: proceed to paper trading.
- Any criterion fails: return to step 1 with a simpler parameter set or more data, not more trials.
- Live shortfall > 50% after 50+ trades: stop, do not add size, investigate regime shift.
9. The real lesson most traders miss about overfitting
Most retail traders treat overfitting as a technical problem to solve once, then move on. It is not. It is a discipline problem that recurs every time you run a new backtest.
The DSR framework, as TrustedQuant explains, requires you to report N_trials precisely because that discipline changes the economics of exploration. When you know that running 500 trials forces a 7-year MinBTL and a steep DSR penalty, you stop running 500 trials. The math does not just measure overfitting — it discourages it.
The second thing most traders miss: simplicity is not a compromise. A strategy with two parameters that passes DSR on 3 years of data is more deployable than a 10-parameter system that barely passes on 7 years. The TradingView Strategy Tester gives you the raw numbers, but interpreting them correctly requires the full diagnostic stack described here. Skipping any one step — especially N_trials logging — makes the rest uncomputable.
Big Move Algo gives you signals built to survive out-of-sample
Retail traders who follow the workflow above still need a baseline indicator that was not itself curve-fitted during development. Big Move Algo’s TradingView indicator is built with that constraint in mind: the built-in Fake Trend Detector filters out low-quality market regimes before a signal fires, which directly reduces the kind of regime-specific overfitting that destroys live performance.
AUTO Mode keeps the parameter count minimal by design, limiting the surface area for curve-fitting from the start. Manual Mode lets experienced traders apply the diagnostic workflow described here to their own customizations. The indicator works across crypto, forex, stocks, indices, and commodities, so multi-instrument validation is straightforward from day one.
If you are ready to integrate Big Move Algo into your TradingView setup, connect your TradingView account and start forward-testing with a clean, documented parameter set.
Sources
- HOW TO SPOT BACKTEST OVERFITTING
- The probability of backtest overfitting
- Research-grade validation toolkit for trading strategies — detect backtest overfitting (PSR, Deflated Sharpe, PBO/CSCV, walk-forward, Harvey-Liu haircut). MIT.
- Overfitting a Backtest: How to Measure It and What It Costs You – TrustedQuant
- How to Avoid Curve Fitting in a Trading Strategy
This article is general information, not a substitute for advice from a qualified financial advisor. Consult a qualified financial professional about your own circumstances before acting on anything here.