What Is a TradingView Watchlist? Trader's Guide
- Steven Hartwell

- Jun 4
- 9 min read

A TradingView watchlist is a user-created panel that displays live prices, percentage changes, and key data for a curated set of financial instruments in one place. Think of it as your personal market dashboard: instead of hunting across charts and screeners, every asset you care about sits in a single, real-time view. Whether you trade crypto, forex, stocks, or commodities, the watchlist is the organizational backbone of your daily workflow. This guide covers what a TradingView watchlist does, how to build one properly, and how to use its advanced features to make faster, sharper trading decisions.
What is a TradingView watchlist and why does it matter?
A TradingView watchlist is defined as a user-created list of financial instruments monitored in one place with live price and percentage change data. That definition sounds simple, but the practical impact is significant. Every second you spend searching for a symbol is a second you are not analyzing price action or managing a position.
The watchlist panel sits on the left side of the TradingView chart interface. Click any symbol in the list and the chart updates instantly. This frictionless switching is the core value: you move from observation to analysis in one click, without losing your indicator setup or chart layout. TradingView syncs watchlists across devices, so the list you build on your desktop is available on your phone or tablet without any extra steps.

Watchlists also connect directly to alerts, news feeds, and the built-in screener. That integration turns a simple list into a monitoring system. A well-built watchlist does not just show you what prices are doing. It tells you which assets deserve your attention right now.
How to create and organize a TradingView watchlist
Setting up a watchlist takes under two minutes, but organizing it well takes deliberate thought. Here is a step-by-step process that professional traders actually use.
Open the watchlist panel. On any TradingView chart, the watchlist panel appears on the left side by default. If it is hidden, click the panel icon in the top-left toolbar to reveal it.
Add symbols. Click the “+” icon at the top of the watchlist panel and type any ticker, pair, or asset name. TradingView supports stocks, ETFs, forex pairs, crypto, indices, and commodities from hundreds of exchanges worldwide.
Create sections. Right-click inside the watchlist and select “Add section.” Sections act as collapsible folders within a single list. Label them by market (Crypto, Forex, Stocks) or by strategy (Momentum, Breakout, Swing).
Build multiple watchlists. Click the list name at the top of the panel to create a new watchlist. Most traders maintain at least three: one for active trades, one for assets under monitoring, and one for macro instruments like indices and commodities.
Name everything clearly. Vague names like “List 1” or “Watchlist 2” create confusion during fast-moving sessions. Use names like “Active Longs,” “Crypto Watchlist,” or “Weekly Setups.”
Structuring watchlists into sections with 10 to 15 symbols per section aids cognitive focus and speeds up your session review. More than 15 symbols per section and you start skipping rows. Fewer than five and you are probably missing opportunities worth tracking.
Pro Tip: Keep each section to under 15 symbols. If a section grows beyond that, split it into two. A focused list you actually review beats a bloated list you scroll past.
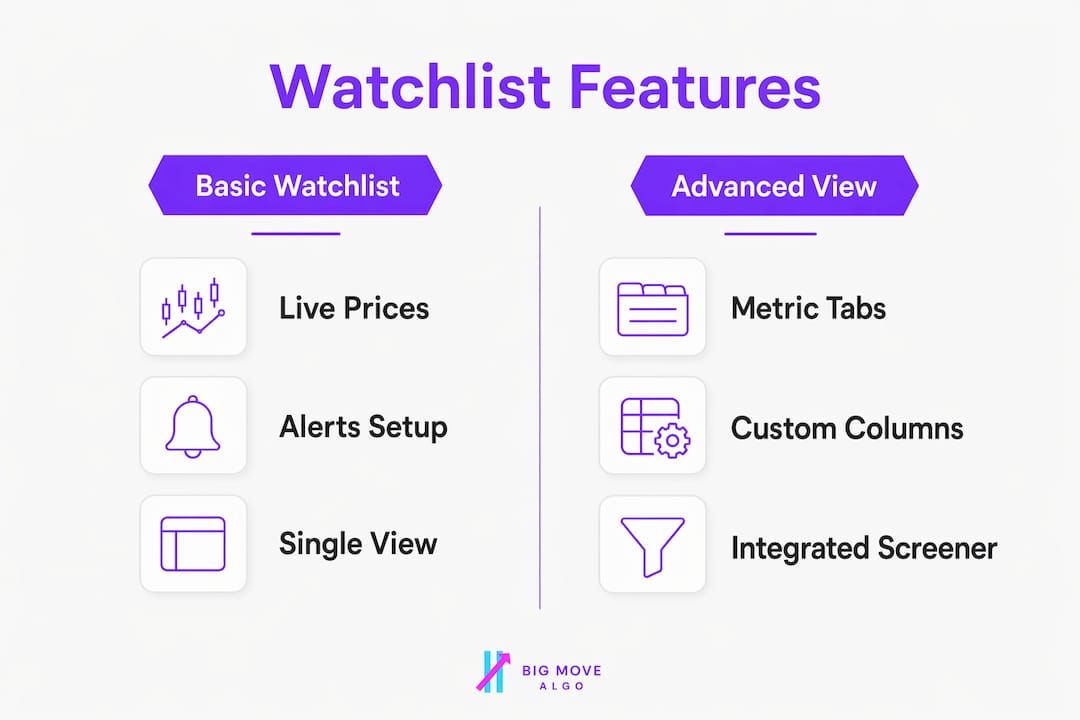
How does advanced view mode transform your watchlist?
Advanced view mode converts your watchlist from a simple price ticker into a multi-metric screening table. Activating it takes one click: right-click anywhere in the watchlist panel and select “Advanced view.” The panel expands to show tabbed data columns alongside each symbol.
The available tabs cover the full analytical spectrum:
Price: Live price, change percentage, volume, and market cap.
Financials: Revenue, earnings per share, P/E ratio, and dividend yield for stocks.
Performance: Returns over 1 day, 1 week, 1 month, 3 months, 6 months, and 1 year.
Risk: Volatility metrics and beta values.
Technicals: Oscillator and moving average summaries, plus an overall technical rating.
Advanced view mode adds these metric tabs so traders can analyze and screen symbols without opening separate charts. That matters because chart-by-chart review is slow. Scanning a column of technical ratings or performance figures takes seconds and surfaces the strongest candidates immediately.
You can customize which columns appear within each tab to match your trading approach. A momentum trader might prioritize the 1-month performance column and the technical rating. A value investor might focus on P/E ratio and dividend yield. The table below shows how different trading styles map to specific advanced view tabs.
Trading style | Most useful tab | Key columns to watch |
Momentum trading | Performance | 1-month return, 3-month return |
Technical swing trading | Technicals | Overall rating, oscillator summary |
Fundamental stock picking | Financials | P/E ratio, EPS, revenue growth |
Volatility-based trading | Risk | Beta, volatility percentage |
Pro Tip: Treat your watchlist columns as the front-end screening layer of your trading system. Filter by technical rating or performance first, then open charts only for the top candidates. This cuts chart review time by more than half.
How do watchlist alerts simplify market monitoring?
Individual alerts are powerful but slow to set up. Creating one alert per symbol across 30 assets takes significant time and produces a cluttered alert list that is hard to manage. TradingView’s watchlist alerts solve this by letting you create alerts across multiple symbols in a watchlist simultaneously, with automatic syncing when you add or remove symbols.
The alert limits vary by subscription plan. As of 2025, the Premium plan allows 2 active watchlist alerts, the Expert plan allows 10, and the Ultimate plan allows 15. Each watchlist alert applies the same condition to every symbol in the list, so one setup monitors your entire universe at once. This is the core efficiency gain: one configuration, many instruments.
The dynamic syncing is the feature most traders overlook. When you add a new symbol to a watchlist, any active watchlist alert automatically includes it. Remove a symbol and the alert stops tracking it. Managing the list itself is the primary configuration lever for controlling alert scope. This means watchlist hygiene directly controls alert quality.
Here is how individual alerts compare to watchlist alerts in practice:
Feature | Individual alerts | Watchlist alerts |
Setup time | One alert per symbol | One setup for all symbols |
Scope updates | Manual, symbol by symbol | Automatic with list changes |
Alert management | Separate alert for each asset | Centralized through watchlist |
Best for | Specific price levels | Broad condition monitoring |
Removing inactive or irrelevant symbols keeps alerts targeted and prevents notification fatigue. A watchlist with stale symbols generates noise. A clean, current list generates signal. Reviewing your watchlist weekly and cutting symbols that no longer fit your thesis is one of the highest-leverage habits you can build. For a deeper look at how trade signals generate alerts across multiple instruments, the mechanics translate directly to watchlist-based monitoring.
Integrating watchlists into your trading workflow
A watchlist is most powerful when it connects to every other part of your trading process, not just price monitoring. TradingView provides one direct integration that most traders underuse: converting a watchlist into a portfolio.
Here is how to build a workflow that uses watchlists at every stage:
Build a research watchlist. Add any asset that catches your attention during scanning or news review. This is your unfiltered idea pool.
Promote to an active watchlist. After analysis, move qualified candidates to your active watchlist. This list drives your daily session review and alert setup.
Convert to a portfolio. TradingView lets you convert a watchlist into a portfolio by selecting a historical start date. Entry prices are set to the closing prices of that date, so your PnL calculation reflects real performance from a specific point in time rather than from the watchlist creation date.
Maintain a macro watchlist. Keep a separate list for indices like the S&P 500, VIX, DXY, and key sector ETFs. This gives you market context without cluttering your active trading list.
Review and prune weekly. Remove symbols that have broken their thesis, completed their move, or no longer fit your current strategy focus.
A curated and well-maintained watchlist directly correlates to reviewing the right instruments every session and missing fewer trade opportunities. That is not a soft claim. Traders who review a focused list of 20 to 40 symbols consistently outperform those who try to monitor 200 assets with no structure. Cognitive bandwidth is finite, and your watchlist is how you allocate it. Pairing this structure with a solid day trading routine compounds the benefit further.
Pro Tip: Use the portfolio conversion feature to track hypothetical trades before committing capital. Set the start date to when you first identified the setup and watch how the position would have performed. It builds pattern recognition without risking real money.
Key takeaways
A well-organized TradingView watchlist is the single most effective tool for reducing decision fatigue and keeping your trading focused on the right assets at the right time.
Point | Details |
Core definition | A TradingView watchlist displays live prices and data for user-selected instruments in one panel. |
Organization structure | Use sections of 10 to 15 symbols and multiple watchlists for different trading functions. |
Advanced view screening | Activate advanced view to filter candidates by technicals, performance, or financials before opening charts. |
Watchlist alerts | One watchlist alert covers all symbols in the list and updates automatically as the list changes. |
Portfolio integration | Convert any watchlist to a portfolio with a historical start date to track real PnL from a chosen point. |
Why watchlist discipline is the habit most traders skip
I have reviewed trading setups from hundreds of retail traders over the years, and the pattern is consistent: the traders who struggle most are not missing a better indicator or a smarter strategy. They are missing structure. Their watchlists are either empty or contain 300 symbols with no organization, which is functionally the same problem.
The traders who perform consistently share one habit: they treat their watchlist like a curated shortlist, not a bookmark folder. They add assets with a reason and remove them when that reason expires. They use sections to separate what they are trading now from what they are watching for later. They review the list before every session, not during it.
The advanced view mode is where I see the biggest gap between what TradingView offers and what most traders actually use. Scanning a column of technical ratings takes 30 seconds and surfaces the two or three assets worth analyzing in depth. Most traders skip this and go straight to charts, which means they spend an hour reviewing assets that a 30-second scan would have eliminated. That is not a workflow problem. It is a habit problem.
Watchlist alerts compound this further. Setting one alert condition across your entire active list means you get notified when opportunity appears, rather than checking manually every hour. The traders who use this feature consistently report fewer missed entries. The ones who skip it rely on memory and manual checking, which fails under pressure.
Build the watchlist first. The signals and strategies come after.
— James
Take your TradingView watchlist further with Big Move Algo
A well-organized watchlist tells you what to watch. Big Move Algo tells you when to act. Big Move Algo is a proprietary TradingView indicator that delivers real-time Long, Short, and Exit signals across crypto, forex, stocks, indices, and commodities. The built-in Fake Trend Detector filters out low-quality setups so your watchlist alerts trigger on conditions worth trading, not market noise. AUTO Mode gets you running in minutes, while Manual Mode gives experienced traders deeper control. Pair your structured watchlist with Big Move Algo’s trading signals and you replace guesswork with a clear, repeatable decision process. Explore the plans and pricing to find the tier that fits your alert volume and trading style.
FAQ
What is a TradingView watchlist used for?
A TradingView watchlist is used to monitor live prices, percentage changes, and key metrics for a curated set of financial instruments in one panel. It connects directly to alerts, news, and chart switching for a faster trading workflow.
How many symbols should a TradingView watchlist have?
Keeping each section to 10 to 15 symbols maintains cognitive focus and speeds up session review. Multiple watchlists organized by function (active, monitoring, macro) handle larger asset universes without creating clutter.
Can TradingView watchlist alerts cover multiple symbols at once?
Yes. Watchlist alerts apply one condition to every symbol in the list simultaneously and update automatically when symbols are added or removed. Alert limits depend on your plan: Premium allows 2, Expert allows 10, and Ultimate allows 15 active watchlist alerts.
How do I convert a TradingView watchlist into a portfolio?
Open the watchlist options menu and select the portfolio conversion feature. Choose a historical start date and TradingView sets entry prices to the closing prices of that date, giving you accurate PnL tracking from a specific point in time.
What is advanced view mode in TradingView watchlists?
Advanced view mode adds tabbed metric columns (Price, Financials, Performance, Risk, Technicals) to your watchlist panel, turning it into a screening table. It lets you filter and rank symbols by multiple data points without opening individual charts.
Recommended
Comments