
How Indicators Help You Time the Market in 2026
- Steven Hartwell

- Jun 11
- 8 min read

Market timing indicators are quantitative tools that translate raw price, volume, and economic data into structured signals, helping traders identify when conditions favor entering or exiting a position. Understanding how indicators help time the market separates traders who react emotionally from those who act on probability. Tools like the VIX, the advance/decline line, and composite indicator systems each measure a distinct dimension of market behavior. When used together, they don’t predict the future. They define the odds.
How indicators help time the market: the core concept
The phrase “timing the market” gets a bad reputation because most people attempt it with a single indicator and a gut feeling. The professional approach is different. Indicators function as regime filters and risk meters, not crystal balls. They tell you whether current conditions resemble environments where prices historically rise, fall, or chop sideways.
Think of it this way: a weather forecaster doesn’t know exactly when rain will fall, but a 90% humidity reading combined with falling pressure and incoming cloud cover creates a high-probability forecast. Market timing works the same way. You’re stacking evidence, not predicting certainty. The goal is to identify zones of elevated probability for a move, then size your position accordingly.

This distinction matters enormously for risk management. A trader who treats an RSI reading as a guaranteed reversal signal will overtrade and blow up. A trader who treats that same RSI reading as one piece of evidence within a broader framework will survive long enough to compound.
What are the main categories of market timing indicators?
Combining sentiment, breadth, valuation, and risk indicators is the foundation of any reliable timing framework. Each category measures something different, and each operates on a distinct time horizon.
The four core categories:
Sentiment indicators capture the emotional state of market participants. The VIX measures implied volatility and fear in options markets. The put/call ratio tracks how many traders are buying protection versus speculation. Extreme fear readings on the VIX have historically preceded sharp recoveries. These indicators are most useful over a 1 to 3 month horizon.
Breadth indicators measure whether a trend has broad participation or is driven by a narrow group of stocks. The advance/decline line tracks how many stocks are rising versus falling on a given day. New highs versus new lows data confirms whether a rally is healthy or deteriorating beneath the surface. Breadth divergences, where the index rises but fewer stocks participate, often precede corrections.
Valuation indicators assess whether the market is priced expensively or cheaply relative to fundamentals. The CAPE ratio (Cyclically Adjusted Price-to-Earnings) smooths earnings over 10 years to reduce noise. The Buffett Indicator compares total market capitalization to GDP. These tools operate over 3 to 10 year horizons and are better suited to portfolio allocation decisions than short-term trades.
Risk indicators signal stress in the financial system. The yield curve, specifically the spread between 2-year and 10-year Treasury yields, has preceded every U.S. recession since 1955 when inverted. Credit spreads measure the premium investors demand to hold corporate debt over Treasuries. Widening spreads signal rising default risk and deteriorating economic confidence.
Category | Example Tools | Typical Time Horizon |
Sentiment | VIX, put/call ratio | 1 to 3 months |
Breadth | Advance/decline line, new highs/lows | 1 to 3 months |
Valuation | CAPE ratio, Buffett Indicator | 3 to 10 years |
Risk | Yield curve, credit spreads | 6 to 18 months |
Macroeconomic and yield curve indicators fit a 6 to 18 month window, making them ideal for portfolio rebalancing rather than active trading decisions.
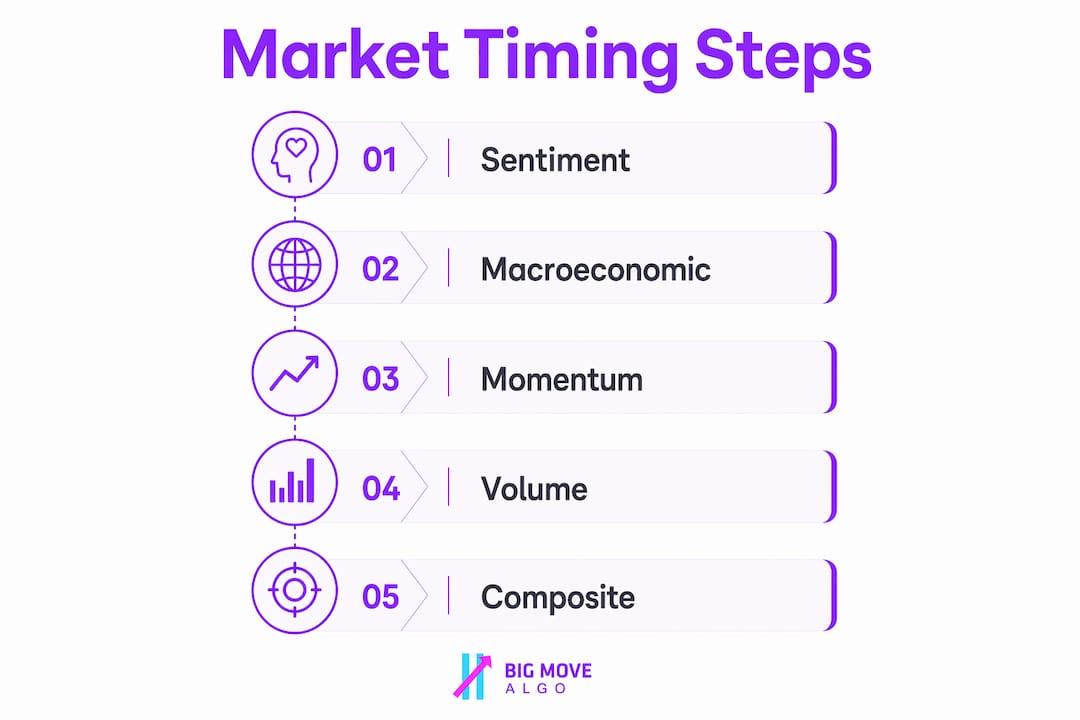
How do traders combine multiple indicators for better accuracy?
No single indicator reliably predicts market turns. The evidence is clear: composite signals reach 75 to 85% historical accuracy when three or more signals from different categories align. That accuracy drops significantly when traders rely on one tool in isolation.
The practical approach is to monitor 2 to 4 complementary indicators from distinct categories. A useful combination for intermediate-term positioning might look like this: the VIX signals extreme fear (sentiment), the advance/decline line confirms broad participation in a recovery (breadth), and the yield curve is no longer inverted (risk). When all three align, the probability of a sustained upward move increases substantially.
The critical mistake most traders make is stacking redundant momentum indicators like RSI, Stochastic, and Williams %R simultaneously. All three measure the same underlying property: momentum. Using them together doesn’t add information. It creates noise and conflicting signals that lead to paralysis or overtrading. The rule is simple: each indicator in your stack must measure something the others don’t.
Indicator Combination | Categories Covered | Signal Quality |
VIX + A/D line + yield curve | Sentiment, breadth, risk | High (3 categories) |
RSI + Stochastic + Williams %R | Momentum only | Low (redundant) |
CAPE + credit spreads + VIX | Valuation, risk, sentiment | High (3 categories) |
Pro Tip: Build your indicator stack like a panel of specialists, not a committee of clones. One sentiment expert, one breadth analyst, one risk economist. Each brings a different lens to the same market.
What are common pitfalls when using market timing indicators?
The most expensive mistake in technical analysis is treating indicators as precise entry signals rather than probability tools. Indicators serve as risk meters, and the Average True Range (ATR) is a textbook example: it doesn’t tell you direction, but it tells you how much the market is moving, which directly informs how large a position you should take relative to your risk tolerance.
Here are the most common pitfalls and how to sidestep them:
Lookahead bias in backtesting. Triggering trades on the same candle that generates a signal inflates historical performance. The correct method is to confirm the signal on candle close and execute on the next candle open. This one adjustment alone can eliminate the false confidence that destroys live accounts.
Misapplying mean-reversion tools in trending markets. Indicators as regime filters prevent this error. An RSI overbought reading in a strong uptrend is not a sell signal. It’s a sign of momentum. Using it as a reversal cue in that context is a category error.
Ignoring timeframe alignment. A daily chart signal and a weekly chart signal pointing in opposite directions are not confirmation. They’re conflict. Always align your indicator readings to the timeframe of your intended trade.
Overriding risk controls with indicator confidence. Even a high-probability setup fails regularly. Indicators inform position sizing and stop placement. They don’t replace them.
Pro Tip: Before adding any indicator to your strategy, ask: “What does this measure that my existing indicators don’t?” If you can’t answer clearly, leave it out. Clarity beats complexity every time.
How to apply market timing indicators effectively
Effective use of market timing indicators requires a structured routine, not ad hoc chart checking. Here is a practical framework for integrating technical indicators for timing into your weekly process:
Select 3 to 5 indicators covering different categories. At minimum, cover sentiment and breadth for short-term decisions, and include one risk indicator for broader context. Avoid doubling up within a category.
Review indicator readings at the same time each week. Consistency matters. Sunday evening or Monday morning before the open works well for most traders. Record the readings in a simple log, noting whether each indicator is at an extreme, neutral, or transitioning.
Flag extreme readings for early positioning. Extreme VIX spikes above 30 have historically marked buying opportunities in U.S. equities. Extreme breadth deterioration, where the advance/decline line diverges from price for three or more weeks, often precedes corrections by 4 to 8 weeks.
Adjust allocation based on composite signal direction. When multiple indicators align bearishly, reduce equity exposure and shift toward defensive assets like bonds or gold. When they align bullishly, increase equity allocation. This is how data-driven timing strategies switching exposures based on risk-off signals have outperformed a 100% S&P 500 buy-and-hold approach, returning $15.3 million versus $4.1 million over 36 years from 1990 to 2026. That performance gap is the compounding effect of avoiding the worst drawdowns.
Use technology to automate alerts. Manually tracking five indicators across multiple markets is error-prone. Platforms like TradingView allow you to set alerts when indicators cross key thresholds, so you act on signals rather than miss them. Knowing how to customize TradingView signals for your specific indicator stack dramatically reduces the chance of missing a high-probability setup.
The discipline of this routine is where most traders fail. They build a system, follow it for two weeks, then abandon it after one losing trade. The edge in using indicators for trading comes from consistency over hundreds of decisions, not perfection on any single one.
Key takeaways
Effective market timing requires combining indicators from distinct categories to identify high-probability zones, not precise entry points, and applying them consistently within a structured risk framework.
Point | Details |
Indicators as probability tools | Use indicators to define favorable conditions, not to predict exact price moves. |
Four core categories | Cover sentiment, breadth, valuation, and risk for a complete market picture. |
Composite signal accuracy | Three or more aligned signals from different categories reach 75 to 85% historical accuracy. |
Avoid redundancy | Never stack RSI, Stochastic, and Williams %R together. They measure the same thing. |
Routine beats reaction | Weekly indicator reviews and logged readings outperform ad hoc chart checking over time. |
Why I think most traders misuse indicators entirely
After years of watching traders blow up accounts with sophisticated-looking setups, I’ve come to a firm conclusion: the problem isn’t the indicators. It’s the expectation placed on them.
Most traders approach indicators looking for certainty. They want a tool that says “buy here, sell there” with no ambiguity. When an indicator fails to deliver that, they either abandon it or add more indicators, hoping the next one will finally be the magic answer. Neither approach works.
The traders I’ve seen succeed treat indicators the way a doctor reads lab results. A single elevated reading doesn’t diagnose a disease. It raises a question. You order more tests. You look for patterns across multiple markers. You form a probability-weighted assessment, then act with appropriate caution. That’s exactly how conflicting indicators confuse traders and why the solution is framework, not more data.
The other thing I’d push back on is the idea that more sophisticated indicators produce better results. The CAPE ratio and the VIX are decades-old tools. The advance/decline line is even older. They still work because they measure real things: fear, participation, and valuation. Complexity doesn’t add edge. Discipline does.
What actually separates profitable traders is the willingness to follow their indicator framework even when it contradicts their gut. That’s harder than it sounds. When the VIX is spiking and every headline screams disaster, buying into that fear requires genuine conviction in your process. The indicators give you that conviction, if you’ve done the work to understand what they actually measure.
— Steven Hartwell
How Big Move Algo puts these signals to work for you
Understanding market timing indicators is one thing. Acting on them in real time, across multiple markets, without second-guessing every candle, is another challenge entirely.

Big Move Algo is a proprietary TradingView indicator that aggregates complementary market signals and delivers clear Long, Short, and Exit calls directly on your chart. The built-in Fake Trend Detector filters out low-quality setups, the same type of noise that trips up traders who rely on a single momentum indicator. With up to 92% win rate signals across crypto, forex, stocks, indices, and commodities, Big Move Algo removes the guesswork that kills most timing strategies. AUTO Mode gets you running in minutes, while Manual Mode lets experienced traders fine-tune their approach. If you want to see how algo trading creates passive returns by acting on structured signals, Big Move Algo is built exactly for that.
FAQ
What is the most reliable indicator for timing the market?
No single indicator is most reliable on its own. Composite signals from three or more categories reach 75 to 85% historical accuracy, far outperforming any individual tool.
Why do professional traders avoid using too many indicators?
Stacking redundant indicators like RSI, Stochastic, and Williams %R creates conflicting signals without adding new information. Professionals select distinct tools that each measure a different market dimension.
Can market timing indicators replace stop-loss orders?
No. Indicators inform position sizing and entry conditions, but they don’t replace risk controls. Even high-probability setups fail regularly, and stop-loss orders protect capital when they do.
How often should I review my timing indicators?
A weekly review covering 3 to 5 indicators from different categories is the standard practice for most active traders. Recording readings over time helps you spot extreme levels that historically precede major moves.
What is lookahead bias and why does it matter?
Lookahead bias occurs when backtest trades trigger on the same candle that generates the signal, inflating historical performance. Always confirm on candle close and execute on the next candle to get realistic results.
Recommended
Comments