
Combine Indicators for Smarter Trading Decisions


Combining indicators for smarter trading decisions is defined as selecting two or more technical tools that each answer a different market question, so their signals confirm each other rather than repeat the same information. Most traders who struggle with analysis paralysis are not using too few indicators. They are using too many that measure the same thing. Professional guidance recommends limiting your toolkit to 3–5 disciplined tools, each assigned a distinct role covering trend, momentum, volatility, and volume. When you build a setup this way, every signal on your chart earns its place.
How to combine indicators for smarter trading decisions
The foundation of effective indicator combination is the one-tool-per-job framework. Every indicator you add must answer a question that no other tool on your chart already answers. The five core roles are bias, setup, trigger, confirmation, and risk management. Assign one indicator to each role, and your chart stays readable under pressure.
The four main indicator categories map directly to those roles:
Trend indicators (moving averages, ADX) establish directional bias. They tell you which way the market is leaning before you look for an entry.
Momentum indicators (RSI, MACD) identify the speed of price movement. They work best as triggers or setup filters.
Volatility indicators (Bollinger Bands, ATR) measure how much price is moving. ATR is the standard tool for setting stop-loss distances.
Volume indicators (OBV, Volume Profile) confirm whether price moves have real participation behind them.
Pairing a lagging indicator with a leading indicator is the most reliable structural choice. Lagging indicators confirm trends while leading indicators forecast entry timing. A moving average tells you the trend has already established itself. RSI tells you whether momentum supports entering right now. Together, they balance timing and accuracy in a way that two lagging or two leading indicators cannot.
Pro Tip: Before adding any indicator to your chart, write down the exact question it answers. If another tool already answers that question, skip it.

The most common structural error is combining RSI, Stochastic, and CCI in the same setup. All three measure momentum. Combining these oscillators creates redundant signals, not confluence. True confluence means independent agreement across different indicator types, not three tools saying the same thing in slightly different ways.
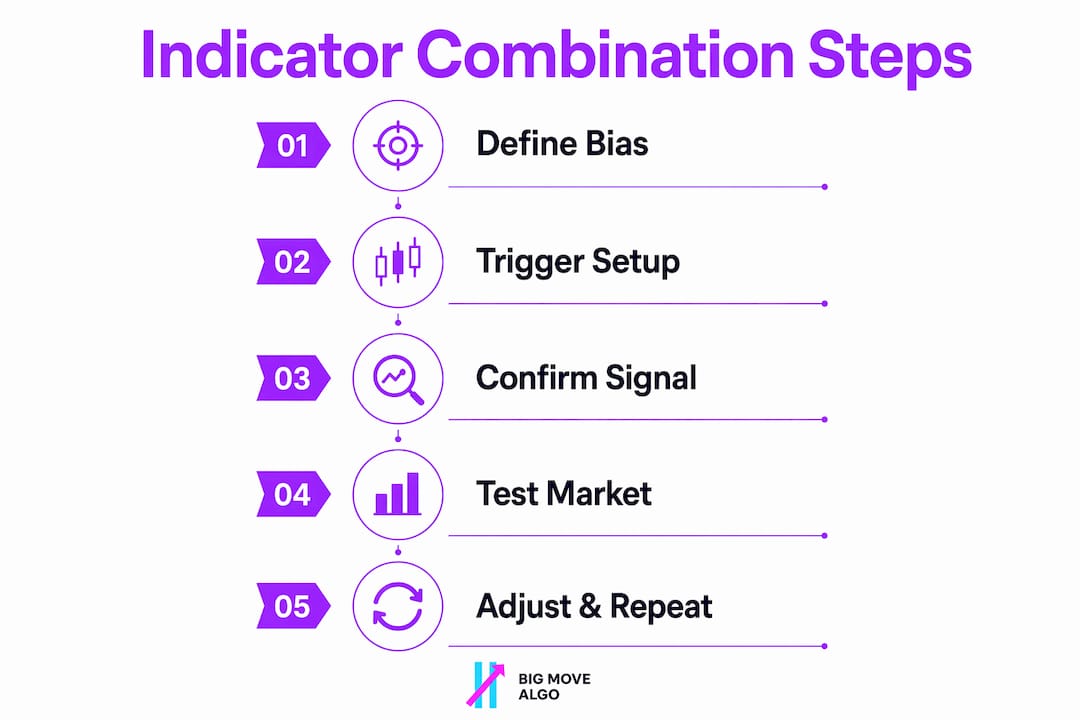
How to build a working indicator combination step by step
Start with one indicator and test it alone before adding anything else. This forces you to understand what that tool actually tells you, and what it misses. Most traders skip this step and end up with charts they cannot interpret under live market conditions.
A practical starting combination is the Simple Moving Average paired with RSI:
Set your trend filter. Apply a 200-period SMA to your chart. Only consider long trades when price is above the SMA, and short trades when price is below it. This single rule eliminates a large portion of low-probability setups.
Add your momentum trigger. Apply RSI with a standard 14-period setting. Look for RSI crossing above 30 (oversold recovery) in an uptrend, or crossing below 70 (overbought rejection) in a downtrend.
Define your time frame. Match your indicator settings to your trading style. Swing traders using daily charts need wider SMA periods than scalpers on 15-minute charts. Mismatched time frames produce conflicting signals even from well-chosen indicators.
Set your risk tool. Add ATR to calculate stop-loss distance. A 1.5x to 2x ATR stop keeps your risk proportional to actual market volatility rather than arbitrary price levels.
Backtest before going live. Run the combination on at least 12 months of historical data across different market conditions. Count the number of signals, win rate, and average risk-to-reward ratio.
A two-indicator SMA + RSI strategy outperformed a five-indicator overfitted strategy over 2.4 years of Bitcoin/USDT data, delivering a 25% return and a 100% win rate while the complex strategy generated zero trades. That result is not a coincidence. It reflects what happens when you add conditions until the strategy only fits the past.
Pro Tip: Write one sentence describing what each indicator uniquely contributes before you finalize your setup. If you cannot write that sentence, the indicator does not belong on your chart.
Indicator | Role | Signal type |
200 SMA | Trend bias | Lagging |
RSI (14) | Momentum trigger | Leading |
ATR (14) | Risk management | Lagging |
Bollinger Bands | Volatility filter | Lagging |
ADX (14) | Trend strength | Lagging |
What mistakes do traders make when combining indicators?
The most damaging mistake is adding indicators to fix a losing strategy rather than to answer a new question. Traders often add popular indicators without verifying that each one adds a unique perspective. The result is an overloaded chart that produces conflicting signals and slower decision-making exactly when speed matters most.
Overfitting is the second major trap. Over-optimization curve-fits a strategy to past data, producing a setup that looks perfect in backtesting but generates zero real trades in live markets. Every condition you add narrows the number of qualifying setups. Add enough conditions and the strategy stops working entirely.
The cleaner your chart, the clearer your thinking. A trader who understands two indicators deeply will always outperform a trader who half-understands six. Indicator overload does not create safety. It creates hesitation.
Here is a practical list of do’s and don’ts for combining trading signals without losing clarity:
Do:
Assign each indicator a single, named role before adding it
Test each new indicator in isolation first
Use one lagging and one leading indicator as your core pair
Backtest across multiple market conditions, not just trending periods
Don’t:
Stack two momentum oscillators and call it confirmation
Add indicators after a losing streak to “fix” the strategy
Use the same indicator on two different settings as if they are independent
Ignore indicator overload until your win rate collapses
Timing mismatches between lagging and leading indicators also cause problems. Pairs of two lagging indicators delay entries. Pairs of two leading indicators produce premature signals. The balance between the two is what keeps your entries accurate without being too early or too late.
What are the best indicator combinations for trading?
Research-backed combinations consistently outperform arbitrary pairings because they pair tools from different categories. Effective combinations for stabilizing entries typically pair a volatility tool with a momentum or trend strength tool. Bollinger Bands with ADX and Bollinger Bands with RSI are two of the most studied pairings in this category.
Bollinger Bands measure price volatility and identify when price is extended relative to its recent range. ADX measures trend strength without indicating direction. When Bollinger Bands show a price squeeze and ADX confirms a strengthening trend, the combination filters out choppy, low-quality conditions that trap traders in false breakouts.
The SMA with RSI pairing works differently. The SMA defines the directional bias, and RSI identifies when momentum aligns with that bias. This setup is particularly effective on daily and four-hour charts where trends develop over days rather than minutes.
Combination | Primary function | Best market condition |
SMA + RSI | Trend bias + momentum trigger | Trending markets |
Bollinger Bands + ADX | Volatility filter + trend strength | Breakout conditions |
Bollinger Bands + RSI | Volatility range + momentum | Range-bound markets |
Moving average + ATR | Trend bias + risk sizing | All conditions |
Volume indicators add a third layer of confirmation when price action alone is ambiguous. A price breakout accompanied by rising volume carries more weight than one on thin volume. Technical signal analysis shows that volume confirmation reduces false breakout entries significantly across equity and crypto markets.
Trading success also depends on combining indicators with non-technical factors like risk tolerance and market conditions. No indicator combination removes the need for position sizing discipline and an understanding of the broader market environment.
Pro Tip: Test your combination in a ranging market and a trending market separately. A setup that only works in one condition is not a complete strategy.
Key Takeaways
Combining indicators effectively requires assigning each tool a distinct role, pairing lagging with leading indicators, and testing with discipline before going live.
Point | Details |
One tool per job | Assign each indicator a single role: bias, trigger, confirmation, or risk management. |
Lagging meets leading | Pair one lagging indicator with one leading indicator to balance timing and accuracy. |
Simplicity outperforms complexity | A two-indicator SMA + RSI strategy outperformed a five-indicator setup in live market testing. |
Redundancy kills confluence | Combining RSI, Stochastic, and CCI measures the same phenomenon three times, not three independent signals. |
Backtest across conditions | Test your combination in both trending and ranging markets before committing real capital. |
Why fewer indicators build more confidence
Most traders I have watched over the years hit the same wall. They add a third indicator after a losing week, then a fourth, then a fifth. Each one feels like it adds safety. What it actually adds is noise. The chart becomes harder to read, entries get delayed, and the trader starts second-guessing signals that would have been obvious with two clean tools.
The traders who improve fastest are the ones who commit to understanding two or three indicators deeply rather than collecting a dozen. They know exactly what their moving average tells them and exactly what it does not tell them. That clarity is what lets them act quickly when a setup forms.
Backtesting matters, but it has to be honest. Running a strategy on the same data you used to build it is not a test. It is a rehearsal. The real test is running it on data from a different year or a different market condition. If the results collapse, the strategy was fitted to the past, not built for the future.
The one habit that separates disciplined traders from frustrated ones is writing down the role of each indicator before adding it. That single practice eliminates most of the redundancy problems before they start. Fewer, well-chosen tools build real confidence because you understand why each signal appears, not just that it appeared.
— Steven Hartwell
Big Move Algo makes indicator clarity practical
Knowing which indicators to combine is one thing. Executing that combination cleanly under live market conditions is another. Big Move Algo’s Big Move Guard is built for traders who want structured, clear signals without the clutter of overlapping tools.

Big Move Guard applies the one-tool-per-job framework directly inside TradingView, delivering Long, Short, and Exit signals that reflect trend, momentum, and volatility inputs without requiring you to manage each layer manually. The built-in Fake Trend Detector filters out low-quality market conditions before a signal appears. For traders who want to put the principles in this article into practice immediately, Big Move Guard removes the setup friction and lets you focus on execution.
FAQ
How many indicators should I combine for trading?
Professional guidance recommends 3–5 indicators, each assigned a distinct role such as trend bias, momentum trigger, and risk management. More than five indicators typically causes signal conflicts and analysis paralysis.
What is the best two-indicator combination for beginners?
The SMA paired with RSI is the most widely tested starting combination. The SMA defines directional bias and RSI identifies momentum alignment, covering two distinct market questions with minimal chart clutter.
Why does combining RSI and Stochastic not create confluence?
RSI and Stochastic both measure momentum, so their agreement is redundant rather than independent. True confluence requires signals from different indicator categories, such as trend and momentum, to agree simultaneously.
What is overfitting in indicator strategy building?
Overfitting means adding so many conditions that a strategy only matches past data and fails in live markets. A simpler two-indicator combination tested across multiple market conditions consistently outperforms over-optimized multi-indicator setups.
How do I know if my indicator combination is working?
Backtest the combination across at least 12 months of data in both trending and ranging conditions. Track signal count, win rate, and risk-to-reward ratio. A combination that generates zero trades or only works in one market type needs to be simplified.
Recommended
Comments