
What Is Indicator Overload in Trading and How to Fix It


Indicator overload in trading is defined as the excessive use of technical indicators on a single chart, producing conflicting signals that paralyze decision-making rather than clarify it. Most retail traders encounter this problem without recognizing it by name. Over 50% of retail traders report confusion from too many conflicting indicators, with more than half preferring inaction over executing a trade. That statistic reveals the real cost: missed opportunities and eroded confidence. The industry term for this condition is “analysis paralysis,” and it is one of the most common performance killers among retail traders today.
What is indicator overload in trading and why does it happen?
Indicator overload is not a technical failure. It is a behavioral one. Indicator overload reflects a tendency to seek certainty and outsource responsibility, driven largely by confirmation bias. Traders add more tools not because the tools are needed, but because they want permission to enter a trade.
The trap works like this. A trader sees a potential setup but feels uncertain. Instead of acting, they add another indicator to confirm the signal. That indicator conflicts with the first. So they add a third. Each new tool creates a new condition that must be met before the trade is taken. The chart fills up, the signals disagree, and the trader does nothing.
Common behavioral drivers behind this pattern include:
Confirmation bias: Traders look for signals that agree with their existing opinion, not signals that challenge it.
Fear of loss: Adding more indicators feels like reducing risk, even when it only adds noise.
Redundant tools: Popular oscillators like RSI, Stochastic, and MACD are all derived from similar price data, so stacking them provides no independent confirmation.
Decision fatigue: The more conditions a trader sets, the harder each decision becomes.
Emotional crutches: Indicators become a way to avoid accountability for a trade’s outcome.
Pro Tip: Before adding any new indicator, write down the specific question it answers that your current setup cannot. If you cannot name a unique question, skip the indicator.
The overuse of trading indicators is rarely about strategy. It is about psychology. Recognizing that distinction is the first step toward fixing it.
How does indicator overload affect trading performance?
The impact of indicator clutter on performance is direct and measurable. Conflicting signals delay entries, and delayed entries mean worse prices or missed trades entirely. Cognitive load and decision fatigue reduce trader performance across repeated decisions during a session, with quality declining notably by the afternoon. A trader who starts the day sharp can become impulsive or frozen by midday simply from the mental weight of processing too many signals.
Analysis paralysis is the most visible symptom. A trader waits for all indicators to align before entering. That moment rarely arrives.
“Rarely do all indicators align at the perfect trade moment.” The pursuit of perfect confluence delays trades until moves are often exhausted, turning a valid setup into a missed opportunity.
The damage goes beyond missed trades. Cognitive exhaustion from processing too many signals leads to two destructive outcomes: impulsive trades taken out of frustration, and complete inaction born from overwhelm. Neither serves a trading plan. Traders who experience conflicting indicators confusing their decisions often abandon their strategy mid-session, which compounds losses and destroys consistency.
The false confidence problem is equally dangerous. Using multiple momentum indicators does not provide independent confirmation. It repeats the same signal in different visual formats. A trader who sees RSI, Stochastic, and MACD all pointing up believes they have three confirmations. They have one, displayed three times. That false confidence can lead to oversized positions and avoidable losses.
How many indicators should traders use?
Best practices recommend 3–5 indicators, each assigned a specific and non-redundant role. Using 8 or more indicators causes measurable decision delays. The number matters less than the function each indicator serves.

The most effective framework assigns each indicator a distinct job:
Role | Purpose | Example function |
Bias | Determines overall market direction | Trend filter or moving average |
Trigger | Identifies the specific entry point | Momentum signal or breakout confirmation |
Risk | Defines stop placement and position size | Volatility measure or support/resistance level |
Filter | Removes low-quality setups | Volume condition or trend strength reading |
Confirmation | Optional secondary check | Price action pattern or timeframe alignment |
Traders should assign each indicator a unique question to answer, avoiding overlap. When two indicators answer the same question, one is redundant. Remove it.
The most common mistake is stacking multiple indicators from the same category. Combining RSI with Stochastic and MACD places three momentum tools on one chart. They all measure the same underlying price data. A better combination pairs a trend tool with a momentum tool and a volatility measure, since each answers a different question about market conditions.
Pro Tip: Assign a written role to every indicator on your chart. If two indicators share the same role, delete one. Your chart should never have two tools doing the same job.
Obsessing over small parameter tweaks, such as adjusting RSI periods from 14 to 12, produces overfitting rather than genuine edge. Real improvement comes from using indicators with diverse functions, not from fine-tuning redundant ones.
Practical strategies to reduce indicator clutter
Simplifying a trading setup requires a deliberate process, not just removing random tools. These steps build a cleaner, more effective approach:
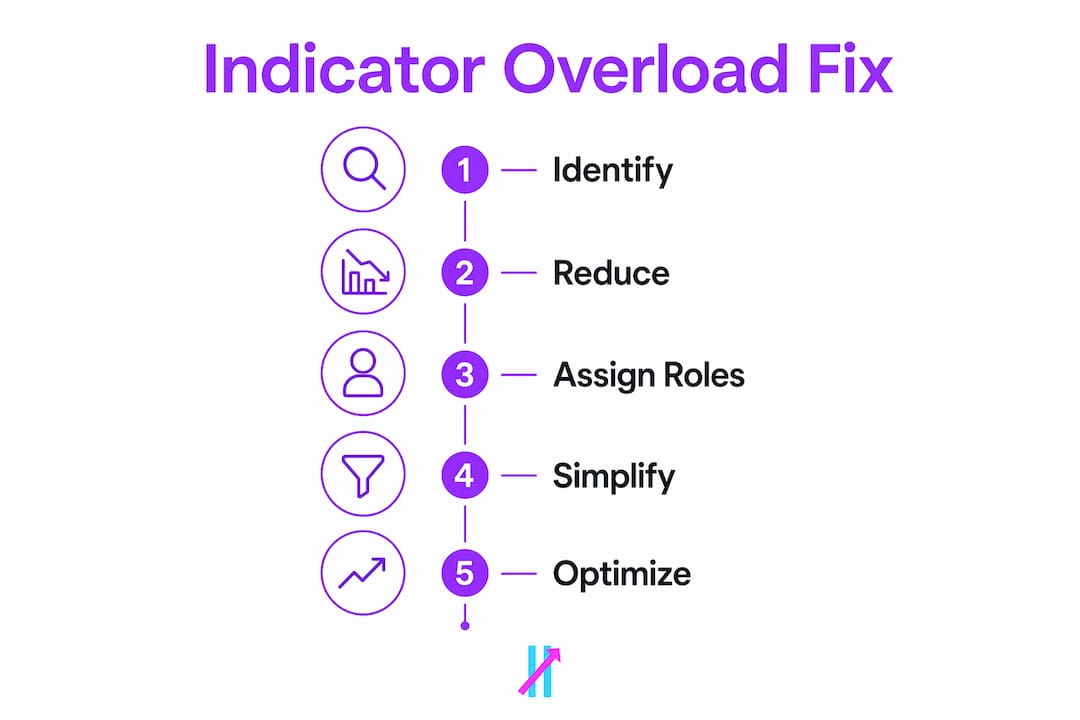
Audit your current chart. List every indicator and write its specific role. Any indicator without a unique role gets removed immediately.
Cap your indicator count at five. Set a hard limit and treat it as a rule, not a guideline.
Build a written trading plan. Define your entry conditions, exit rules, and risk parameters before the session starts. A written plan reduces the temptation to add indicators mid-session.
Track your cognitive fatigue. Setting subjective fatigue ratings and adhering to mental stop-losses protects traders from costly decisions made under cognitive exhaustion. Rate your mental clarity on a simple 1–10 scale before each session.
Reduce exposure in difficult conditions. During low volatility or sideways markets, experienced traders reduce position size or switch to higher timeframes instead of adding more indicators. Fewer tools work better when market conditions are unclear.
Trade the edge, not perfection. Waiting for perfect indicator alignment is a cognitive avoidance strategy. Experienced traders act on a clear edge, knowing that no setup is perfect.
Pro Tip: Use higher timeframes to establish bias, then drop to your trading timeframe for the entry signal. This naturally reduces the number of indicators you need because the higher timeframe does the filtering work.
Learning how to get clear long short trading signals without stacking redundant tools is a skill that improves with deliberate practice and regular chart audits.
What are the signs of indicator overload?
Recognizing trading indicator fatigue early prevents it from damaging performance. These are the clearest warning signs:
Conflicting signals on every setup. If your indicators regularly disagree, you have too many or the wrong combination.
Delayed decisions on obvious setups. You see a clear move forming but wait for one more confirmation that never comes.
Frequent indicator switching. You remove one tool and add another mid-session, searching for a setup that “feels right.”
Mental fatigue by midday. You feel drained after a few hours of watching charts, even without taking many trades.
Missed trades due to waiting. You watch a trade move without you because not all indicators aligned.
Impulse trades after a long wait. Frustration from inaction leads to entering a poor setup just to feel active.
Abandoning your trading plan. You override your rules because the indicators are sending mixed messages.
Any three of these signs appearing regularly indicates a serious indicator overload problem. The solution is always simplification, not addition. Understanding how indicators help time the market effectively starts with using fewer of them with greater intention.
Key Takeaways
Indicator overload is a behavioral problem, not a technical one, and fixing it requires fewer indicators with clearly defined roles rather than more data.
Point | Details |
Definition of overload | Using too many indicators creates conflicting signals and analysis paralysis, not clarity. |
Root cause is behavioral | Confirmation bias and fear of loss drive traders to add redundant tools as emotional crutches. |
Optimal indicator count | Limit charts to 3–5 indicators, each assigned a unique role such as bias, trigger, or risk. |
Redundancy destroys confidence | RSI, Stochastic, and MACD all measure similar price data; stacking them gives false confirmation. |
Fatigue management matters | Track cognitive fatigue daily and reduce position size or step back when mental clarity drops. |
The uncomfortable truth I’ve learned about indicator overload
I spent two years convinced that more indicators meant more information. Every time a trade went wrong, I added another tool to prevent the same mistake. My charts looked like a circuit board. My results got worse, not better.
The turning point came when I stripped everything down to three indicators with distinct jobs. The chart looked almost empty. That emptiness felt uncomfortable at first, like I was missing something. What I was actually missing was noise.
The traders I have watched struggle most with indicator overload share one trait: they treat uncertainty as a problem to be solved with more data. Uncertainty is not a problem. It is the condition of every trade. No indicator removes it. The goal is not certainty. The goal is a consistent edge applied with discipline.
Simplifying your setup forces you to trust your process. That trust is what separates traders who execute well from those who freeze. Price action tells you most of what you need to know. Indicators should confirm what price is already showing, not replace the act of reading the market.
If your chart needs a legend to understand it, it has too many indicators.
— Steven Hartwell
How Big Move Algo cuts through indicator clutter
Retail traders who want a cleaner approach without rebuilding their setup from scratch have a direct path forward.

Big Move Algo is a TradingView indicator built specifically to replace the noise of multiple conflicting tools with three clear signals: Long, Short, and Exit. The built-in Fake Trend Detector filters out low-quality market conditions automatically, so traders are not forced to stack additional filters manually. AUTO Mode requires minimal setup and works across crypto, forex, stocks, indices, and commodities. Traders who want more control can use Manual Mode for additional customization. Big Move Algo delivers the kind of signal clarity that most traders spend years trying to build with too many indicators. See how it works and start trading with a cleaner, more focused setup.
FAQ
What is indicator overload in trading?
Indicator overload in trading is the condition of using too many technical indicators simultaneously, producing conflicting signals that cause confusion and decision paralysis. Over 50% of retail traders report experiencing this problem.
How many indicators should I use on a chart?
Best practices recommend 3–5 indicators, each assigned a unique role such as bias, trigger, or risk management. Using 8 or more indicators causes measurable decision delays.
What are the signs of trading indicator fatigue?
Common signs include delayed decisions on clear setups, frequent indicator switching mid-session, mental exhaustion by midday, and missing trades while waiting for all indicators to align.
Why do multiple momentum indicators give false confirmation?
RSI, Stochastic, and MACD are all derived from similar underlying price data. Stacking them creates the appearance of multiple confirmations when they are all reflecting the same signal.
How do I simplify my trading indicators?
Audit every indicator on your chart, assign each a specific role, remove any that share a role with another, and cap your total at five. Write a trading plan before each session to reduce the urge to add tools mid-trade.
Recommended
Comments