
How Buy and Sell Signals Are Calculated for Traders
- Steven Hartwell

- Jun 21
- 8 min read

Buy and sell signals are algorithmically calculated triggers derived from market indicators like Moving Averages, RSI, and MACD that tell traders when to enter or exit a position. Understanding how buy and sell signals are calculated separates traders who follow a repeatable process from those who guess. The core calculation methods, including Moving Average crossovers, RSI thresholds, MACD divergence, and multi-indicator confirmation, each produce different types of signals with different reliability levels. Combining these methods, and knowing when each one works best, is what separates a useful signal from noise.
What are the primary indicators used to calculate buy and sell signals?
Buy and sell signals are calculated by algorithms that aggregate price and volume data into mathematical formulas. The output of those formulas becomes the trigger. Three indicators form the foundation of most buy sell signal methodology used today.
Moving Average crossovers
A Moving Average crossover fires a signal when a shorter-period average crosses above or below a longer-period average. The most widely referenced example is the 50-day Moving Average crossing above the 200-day Moving Average, commonly called the “Golden Cross,” which generates a buy signal. The reverse, a “Death Cross,” generates a sell signal. These crossovers work well in trending markets because they confirm direction after momentum has already shifted.

RSI thresholds
The Relative Strength Index (RSI) measures how fast and how far price has moved on a scale of 0 to 100. A reading below 30 signals an oversold condition, which many algorithms treat as a potential buy trigger. A reading above 70 signals an overbought condition and triggers a potential sell. The threshold logic is straightforward: when price has moved too far, too fast in one direction, a reversal becomes statistically more likely.
MACD crossovers
The Moving Average Convergence Divergence (MACD) indicator compares two exponential moving averages to measure momentum. When the MACD line crosses above its signal line, the algorithm registers a bullish crossover and fires a buy signal. When the MACD line crosses below the signal line, it fires a sell signal. The MACD is particularly useful because it captures both trend direction and momentum strength in a single output.
Standard trend-following tools have win rates of 30–50%, depending heavily on timeframe and market regime. That range tells you something critical: no single indicator is reliable enough to trade on its own.
Pro Tip: Always check which timeframe your indicator is set to before reading a signal. A buy signal on a 1-minute chart carries far less weight than the same signal on a daily chart.
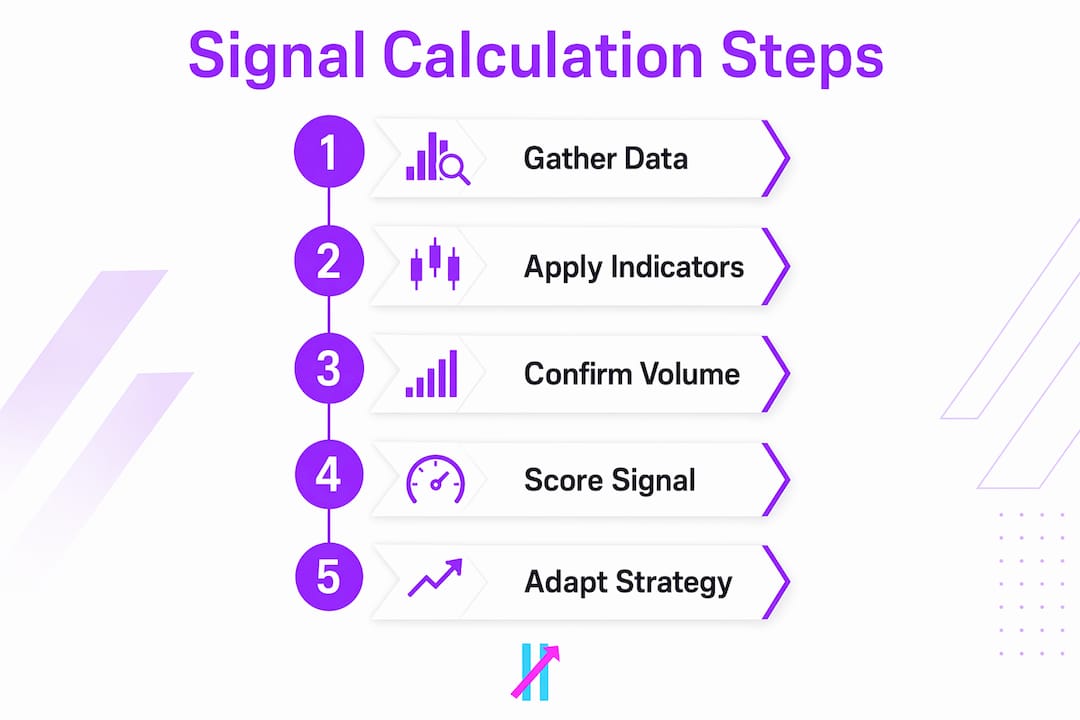
How do traders combine multiple indicators to improve signal accuracy?
Single-indicator signals are noisy and often produce false positives. Confluence, meaning agreement across multiple indicators, is the key to higher win rates. The logic is simple: if three separate calculations all point to the same trade, the probability of that trade succeeding increases.
A common multi-indicator confirmation setup works like this:
RSI below 30 confirms the asset is oversold and due for a potential reversal.
Price above a key Moving Average confirms the broader trend is still bullish.
Volume meets or exceeds the recent average confirms real buying pressure is behind the move.
Combining RSI below 30, price above a moving average, and volume thresholds is a proven setup that cuts noise significantly compared to single-indicator signals. Each filter eliminates a category of false alarms. RSI filters out trades where price is already extended. The Moving Average filter eliminates counter-trend trades. Volume filters out breakouts that lack real participation.
Volume must meet or exceed the recent average during breakouts to confirm signal validity. Low-volume breakouts frequently fail and return price to the prior range. This is why volume is the most underused confirmation tool among retail traders.
A more specific example: a buy signal fires when RSI crosses above 30 (recovering from oversold) plus a MACD bullish crossover occurs simultaneously. A sell signal fires when RSI crosses below 70 plus a MACD bearish crossover confirms. Waiting for candle close before acting on either signal prevents premature entries caused by wicks or intrabar noise.
The challenge with combining indicators is over-engineering. Adding five or six filters can make a signal so rare it never fires. The practical target is two to three confirming conditions, enough to filter noise without making the system useless.
Pro Tip: During choppy, sideways markets, even a three-indicator confirmation setup will produce false signals. Add a trend filter like ADX before trusting any signal in those conditions.
What advanced methods exist for ranking and scoring signals?
Professional algorithms go beyond binary buy/sell outputs. They assign a composite score to each signal based on multiple components, then rank signals by strength. This approach helps retail traders focus on the highest-probability setups instead of treating every signal equally.
Professional signals assign composite scores based on liquidity, trend alignment, and fair value gaps to prioritize trades. A signal that scores +4 on a scale of +4 to -4 is classified as a Strong Buy. A signal scoring +1 is a Weak Buy. The difference matters because a Weak Buy in a choppy market is often not worth taking, while a Strong Buy in a trending market aligns with every major filter.
The components that feed into a signal score typically include:
Component | What it measures |
Trend alignment | Whether price direction matches the signal direction |
Liquidity | Whether volume supports the move |
Fair value gaps | Whether price is near a key imbalance zone |
Momentum | Whether RSI and MACD confirm the direction |
Chop filter | Whether the market is trending or ranging |
Chop-avoidance filters like ADX or volatility measures reduce false signals when markets lack a clear directional trend. Sophisticated algorithms include these filters to improve signal quality before a score is even assigned. A signal that would score +3 in a trending market might not score at all in a ranging market because the chop filter blocks it entirely.
Signal ranking is what separates a clear long/short signal from a vague alert. When you know a signal is a Strong Buy rather than just a buy, you can size your position and set your stop-loss with more confidence.
How do market conditions affect signal effectiveness?
Moving Average crossovers perform well in trending markets but produce many false signals in sideways or choppy conditions. This is the most common reason retail traders lose confidence in their indicators. The indicator is not broken. The market regime changed, and the indicator was not designed for that environment.
Market conditions fall into two broad categories:
Trending markets: Price moves consistently in one direction. Moving Average crossovers, MACD signals, and trend-following RSI setups all perform at their best here. Signal win rates climb because the underlying momentum supports the trade.
Choppy or sideways markets: Price oscillates within a range without clear direction. Moving Average crossovers fire repeatedly as price crosses back and forth. RSI reaches oversold and overbought levels without triggering real reversals. Win rates drop sharply.
Signal performance varies significantly by market regime. Effective traders adapt their strategies to current conditions rather than applying the same settings across all environments. The practical solution is to add a regime filter before any signal is acted on.
The Average Directional Index (ADX) is the most common regime filter. An ADX reading above 25 generally confirms a trending market where crossover signals are reliable. An ADX reading below 20 signals a choppy market where those same crossovers should be ignored. Adapting signal filters to market regime is one of the highest-impact adjustments a retail trader can make.
Volatility filters serve a similar purpose. When volatility contracts sharply, breakout signals become unreliable because there is not enough momentum to sustain a move. Algorithms that include volatility thresholds automatically suppress signals during these low-energy periods.
Pro Tip: Check ADX before entering any Moving Average crossover trade. If ADX is below 20, skip the signal entirely and wait for a trending environment to return.
Key Takeaways
Calculating buy and sell signals requires combining multiple indicators, applying confirmation filters, and adapting to market regime conditions to produce reliable trade triggers.
Point | Details |
Single indicators are unreliable | Trend-following tools have win rates of 30–50%; never trade on one indicator alone. |
Confluence improves accuracy | Combining RSI, Moving Averages, and volume filters cuts false signals significantly. |
Signal ranking adds precision | Composite scores from +4 to -4 help traders prioritize high-probability setups. |
Market regime changes everything | Moving Average crossovers fail in choppy markets; use ADX to confirm trend before acting. |
Volume confirms breakouts | Low-volume breakouts frequently fail; always check volume before entering a signal. |
Why most traders misread their own signals
Most traders treat signals as certainties. They see a buy alert and assume the trade will work. That mindset is the single biggest cause of poor trade management I have observed across years of watching retail traders operate.
Treating signals as probabilities rather than guarantees and following stop-loss and take-profit rules is the primary defense against losing capital. A signal with a 70% win rate still loses 30% of the time. If you do not have a stop-loss in place for those losing trades, three bad trades can wipe out ten winning ones.
The second mistake I see constantly is ignoring volume confirmation. Traders will take a Moving Average crossover or an RSI recovery signal without checking whether volume supports the move. Low-volume breakouts often fail and return price into the prior range. Volume is the one filter that most retail traders skip because it requires an extra step.
Algorithm-based filters remove both of these problems. When a system is built to require volume confirmation, trend alignment, and a chop filter before firing a signal, the emotional shortcuts disappear. You are not deciding whether the signal looks good. The algorithm already checked. That structure is what automated trade signals provide that manual chart reading cannot replicate consistently.
The traders who improve fastest are not the ones who learn the most indicators. They are the ones who pick two or three well-defined criteria, apply them consistently, and stop second-guessing the output.
— Steven Hartwell
See how Big Move Algo calculates signals for you
Understanding the math behind signals is one thing. Having a system that applies it in real time, across every market, without requiring you to manually check five indicators is another.

Big Move Algo is a TradingView indicator that calculates Long, Short, and Exit signals using a multi-layer algorithm built on the exact principles covered here: trend alignment, momentum confirmation, volume filters, and a built-in Fake Trend Detector that blocks signals in choppy conditions. The signal ranking system gives you a clear read on signal strength, not just a raw alert. Big Move Algo claims a win rate of up to 92% across crypto, forex, stocks, indices, and commodities. You can start with AUTO Mode for instant setup or switch to Manual Mode for full customization. Visit Big Move Algo to see live signals and the how-to-use guide.
FAQ
What indicators are used to calculate buy and sell signals?
The most common buy sell signal indicators are Moving Averages, RSI, and MACD. Each measures a different aspect of price behavior: trend direction, momentum, and relative strength.
How do you interpret a buy signal from RSI?
A buy signal fires when RSI crosses above 30, recovering from an oversold condition. Waiting for candle close confirmation before entering prevents false triggers caused by intrabar wicks.
Why do buy and sell signals fail in sideways markets?
Moving Average crossovers produce frequent false signals when markets lack a clear directional trend. Adding an ADX filter above 25 confirms a trending environment before any crossover signal is acted on.
What is a signal strength score?
A signal strength score is a composite ranking, such as +4 for Strong Buy or -2 for Weak Sell, based on factors like trend alignment, liquidity, and momentum. Signal ranking helps traders prioritize high-probability trades over marginal setups.
How many indicators should you combine for a reliable signal?
Two to three confirming indicators is the practical target for calculating buy sell signals. More than three filters can make signals too rare to be useful, while fewer than two increases the rate of false positives.
Recommended
Comments