
How to Detect Trend Reversals Before the Crowd Reacts
- Steven Hartwell

- Aug 22
- 9 min read

A trend reversal is confirmed when price breaks a key swing structure, that break holds on a higher timeframe, and volume or momentum backs it up. Skip any leg of that chain and you’re trading a guess, not a signal.
Run this checklist before you act on any reversal setup:
Structural break: price closes beyond the most recent swing high or low.
Failure to extend: the prior trend fails to print a new higher high (or lower low).
Confirmation: volume expands or momentum (RSI, MACD) diverges from price on the break.
This mirrors the logic behind Thomas Bulkowski’s 1-2-3 Trend Change Method, which found that roughly a significant portion of confirmed instances in his sample climbed substantially from the low after the structural break held. The pattern isn’t magic. It’s just discipline about waiting for proof.
Key Takeaways
A trend reversal is only tradeable once a structural break, higher-timeframe confirmation, and volume or momentum evidence all align in the same direction.
Point | Details |
Wait for structure, not shape | A pattern sighting means nothing until price closes beyond the neckline or swing point. |
Layer at least two signals | Combine structural breaks with volume or momentum divergence to cut false positives. |
Confirm on a higher timeframe | Check at least one timeframe above your entry chart before treating a move as a reversal. |
Size risk to the stop distance | Risk 1 to 2% of equity per trade, with stops placed beyond the invalidating structure. |
Automate with a filter, not just an indicator | Big Move Algo pairs real-time Long/Short/Exit signals with a Fake Trend Detector to screen out low-quality structural breaks. |
Table of Contents
What Signals Actually Detect Trend Reversals?
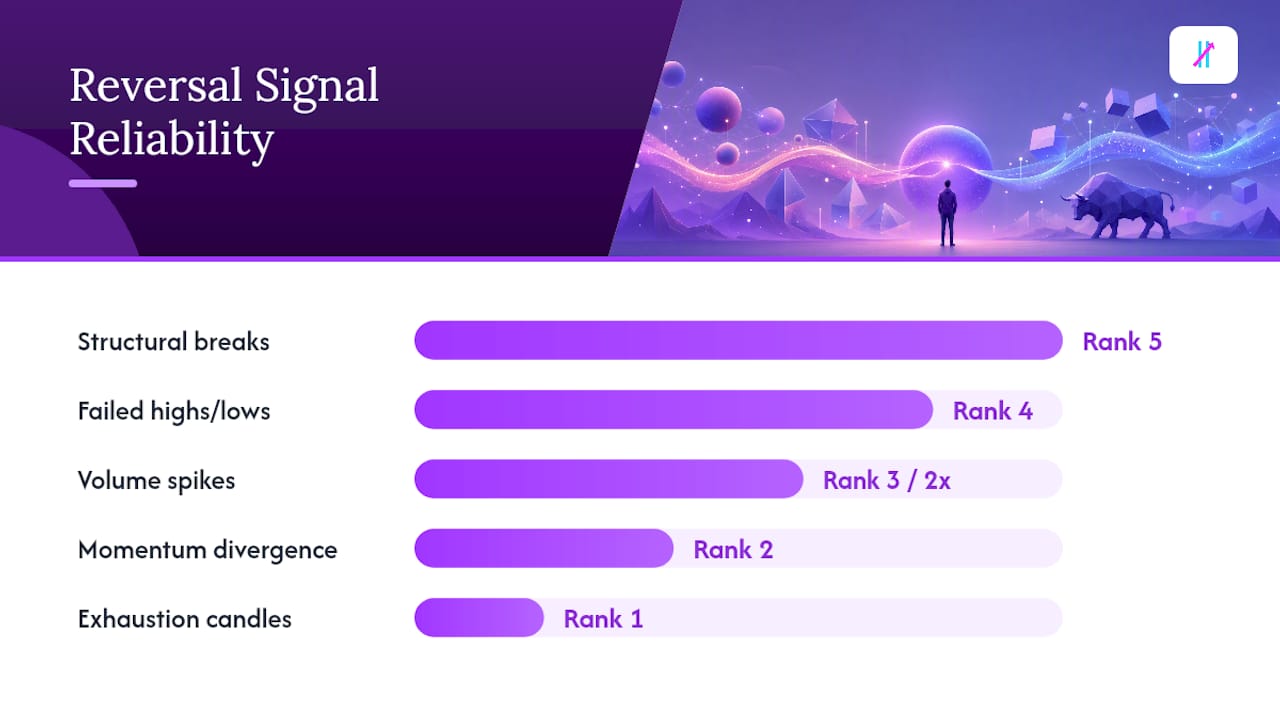
Not all reversal clues carry the same weight. Ranked by reliability, here’s what to watch first:
Structural breaks (price closing past a swing high/low): the most objective signal because it’s binary. Either it broke or it didn’t.
Failed new highs/lows: an uptrend that can’t print a fresh high on the next attempt is telling you buyers are exhausted, even before any breakdown.
Volume spikes on the break: a structural break on 2x average volume means something real is happening. On thin volume, it’s often a trap.
Momentum divergence: price makes a new high or low, but RSI or MACD doesn’t confirm it. This gap often precedes the structural break by several sessions.
Exhaustion candles: long upper or lower wicks at extremes, especially after an extended run, hint at a change in control between buyers and sellers.
Chart Champions’ framework treats the failure to make a new high or low as the primary exhaustion tell, ranking it above candlestick patterns alone. That’s worth internalizing: a single doji at the top of a rally means far less than three failed attempts to break resistance.
Pro Tip: Never trade off one signal. A momentum divergence with no structural break is a warning, not an entry. Wait for at least two of the five signals above to align before you treat a move as a real reversal.
The research backs this layering approach. Guides on reversal and continuation patterns consistently flag volume confirmation as the difference between a real breakout and a fakeout that snaps back within a session or two.
How Do Classic Chart Patterns Confirm a Reversal?
Head and shoulders, double tops, double bottoms, triple tops. These patterns get taught early because they’re visually obvious, but the pattern itself is only half the story. The Pitchfork Primer on reversal vs. continuation patterns makes clear these formations signal potential exhaustion, not guaranteed reversals. Context and confirmation still decide the outcome.
Here’s how to confirm any of them:
Mark the neckline (head and shoulders) or the swing low between peaks (double top) or swing high between troughs (double bottom).
Wait for a closing price beyond that level. Not a wick, a close.
Watch for a retest of the broken level within the next several sessions. Volume-backed rejection at the retest strengthens the case.
Confirm the pattern holds for at least two to three closes past the break before treating it as valid.
When you spot one of these forming, annotate the neckline, the retest zone, and the volume bars on the breakout candle directly on your chart. Reproducing that markup on your own screen, rather than eyeballing it, is what separates a documented setup from a hunch.
Pro Tip: Draw your neckline before the pattern completes, not after. Redrawing lines to fit a breakout you’ve already seen is the single most common form of self-deception in pattern trading.
Which Indicators Confirm a Trend Reversal Without Overfitting?
Indicators should confirm structure, not replace it. Four tools do most of the useful work:
Moving average crossovers: a 50-day crossing above or below a 200-day MA (the golden cross / death cross setup) is a lagging but reliable momentum confirmation, as outlined in SmartAsset’s guide to identifying trend changes.
MACD zero-line crossings: when the MACD line crosses its centerline, it confirms a shift in the balance between short and long-term momentum.
RSI divergence: price prints a new extreme, RSI doesn’t. This is often the earliest warning of the group.
ADX: a falling ADX during a strong trend suggests weakening conviction, even before price structure breaks.
On lower timeframes (5 minute, 15 minute), shorten these periods proportionally. A 200-period MA on a 5 minute chart is a different animal than on daily, but the ratio still matters.
Pro Tip: Pick one trend indicator and one momentum indicator, then stop. Stacking five indicators on one chart doesn’t add confidence, it adds noise and analysis paralysis.
Why Does Multi-Timeframe Confirmation Reduce False Reversals?
A reversal on the 15 minute chart can be nothing more than a pullback on the daily chart. Confirming structure on at least one timeframe above your entry chart filters out this noise and keeps you from fighting the dominant trend.
Watch for these common mistakes:
Mistaking sideways consolidation for a genuine reversal.
Entering before the structural break actually closes.
Ignoring volume or momentum confirmation because the chart “looks” ready.
Run this before committing capital: check the higher timeframe trend direction, confirm the structural break on your entry timeframe, and verify volume or momentum agrees with both. Multi-timeframe alignment, as Trader Gibkey’s analysis explains, is one of the most reliable filters against false breakouts in backtested strategies.
Can You Automate Trend Reversal Detection?
Yes, and it doesn’t require a complex model. A workable heuristic looks like this:
Define the current trend using a moving average slope or higher-high/higher-low sequence.
Test for a structural break: has price closed beyond the most recent swing point?
Apply a volume or momentum filter (MACD histogram shift, RSI divergence) to the break.
Cross-check the higher timeframe trend direction before flagging the signal.
Output a signal only when all three conditions align.
MACD-style fast/slow EMA differences are a commonly used heuristic for detecting slope changes in noisy price series, largely because they’re simple to code and backtest quickly.
For backtesting, don’t trust anything under a few hundred trades. Google Analytics’ own trend-detection documentation recommends roughly a 90-day minimum training window for stable detection on daily data, a reasonable floor even outside web analytics. Always hold out an out-of-sample period; a rule that only works on the data that built it isn’t a rule.
Pro Tip: Log every false signal your script generates during backtesting, not just the wins. The pattern in your false positives usually points straight at the parameter you need to fix.
How Should You Enter, Stop, and Size a Reversal Trade?
Confirmation tells you a reversal is likely. Execution determines whether you profit from it.
Breakout entry: enter on the confirmed structural break itself, accepting slightly worse pricing for earlier participation.
Retest entry: wait for price to pull back to the broken level and hold, which usually offers better risk/reward.
Staged entry: split your position, entering partly on the break and adding on the retest.
For stops, place them beyond the structure that invalidates your thesis. If you’re long off a broken swing low, your stop belongs below that swing low, not at an arbitrary percentage.
Risk no more than 1 to 2% of account equity on any single reversal trade.
Size your position based on the distance between entry and stop, not a fixed share count.
Trail your stop to the next swing point as the new trend develops, and scale out partial size at your first target.
How Big Move Algo Applies These Reversal Rules
Big Move Algo builds this exact checklist into a real-time TradingView indicator instead of leaving traders to track structure, volume, and momentum by hand across multiple charts.
Long, Short, and Exit signals flag structural breaks the moment they’re confirmed, in AUTO Mode or Manual Mode.
The Fake Trend Detector filters out low-quality setups where structure looks broken but volume or momentum doesn’t back it up.
Multi-market coverage across crypto, forex, stocks, indices, and commodities means the same confirmation logic applies whether you’re watching a currency pair or a small-cap stock.
Alerts across platforms let you confirm higher-timeframe context without manually flipping between chart windows.
The gap between spotting a reversal and trusting a reversal is confirmation. Most retail traders lose money not because they can’t see structure breaking, but because they act before volume or a higher timeframe agrees with what they’re looking at.
Traders can review real examples of how these signals play out on live charts in this breakdown of actionable trade signals.
What Traders Get Wrong About Spotting Reversals
The biggest mistake I see in reversal trading isn’t a lack of knowledge. Most traders can define a head and shoulders pattern in their sleep. The failure is patience. They see the shape forming and jump in before the neckline actually breaks, then wonder why the retest wipes them out.
Conventional trading education oversells the pattern and undersells the confirmation. Books show you a textbook double bottom on a clean chart, but they rarely show the ninety failed double bottoms that never confirmed.
If I had to tell a trader one thing to prioritize, it’s this: build the habit of waiting for the third step (the structural break) before you size a position, not the first hint of exhaustion. Momentum divergence and failed highs are your early warning system. They are not your entry trigger. Structure is the entry trigger. Everything else is context that either supports or contradicts what price has already confirmed.
Ready to Put These Reversal Rules to Work?
Reading structure, volume, and momentum across two timeframes by hand, on multiple charts, in real time, is exactly the kind of manual grind that causes traders to miss the confirmation window entirely. Big Move Algo runs this checklist continuously so you see the Long, Short, or Exit signal the moment structure, volume, and momentum actually line up.

Start by testing signal behavior on the instrument and timeframe you already trade most, whether that’s a forex pair on the 1 hour chart or a stock on the daily. Let AUTO Mode handle the structural and volume checks, or switch to Manual Mode if you want to adjust sensitivity yourself. Before risking capital, backtest the signal history on your chosen chart and lean on the Fake Trend Detector to screen out the low-quality setups that would otherwise burn a stop-loss. You can review the setup process in the installation guide or start directly at Big Move Algo.
Frequently Asked Questions
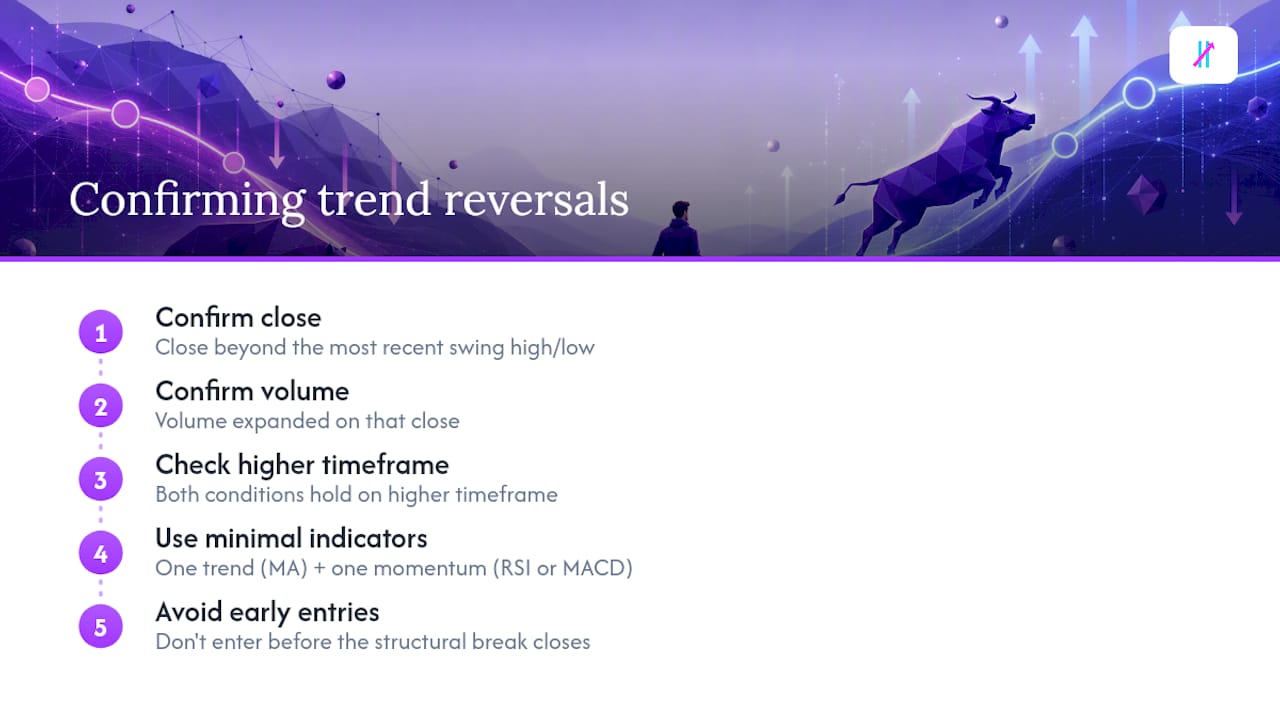
What is the fastest way to detect trend reversals on any chart? Look for a close beyond the most recent swing high or low, then check whether volume expanded on that close. If both hold on a higher timeframe too, you have a reasonable case for a reversal rather than noise.
How do I tell a reversal from a continuation pattern? Reversal patterns like head and shoulders or double tops signal potential exhaustion, while triangles and flags usually signal a pause before the existing trend resumes. The distinguishing factor is what happens at the structural break: a reversal breaks the prior trend’s swing structure, a continuation doesn’t.
Do I need multiple indicators to confirm a reversal? No. One trend indicator (a moving average) and one momentum indicator (RSI or MACD) are usually enough. Stacking more indicators tends to add conflicting signals rather than clarity.
What’s the most common mistake traders make when spotting trend shifts? Entering before the structural break actually closes. Seeing a pattern form and acting on the shape alone, without waiting for the confirmed break, is the single biggest source of false reversal trades.
Can trend reversal detection be automated? Yes. A structural break test, combined with a volume or momentum filter and a higher-timeframe check, can be coded into a screener or TradingView script. Big Move Algo runs this exact logic in real time across crypto, forex, stocks, indices, and commodities.
This article is general information, not a substitute for advice from a qualified financial advisor. Consult a qualified financial professional about your own circumstances before acting on anything here.
Sources
Recommended
Comments