
Forward Testing Guide for TradingView Users
- Steven Hartwell

- Aug 20
- 9 min read

Forward testing means running your trading strategy on live market data, using paper trading or a very small real position, before you commit full capital. It’s the step between “this looks good on a chart” and “this actually works.”
A valid forward test needs four pieces in place:
A Pine Script strategy or published indicator loaded onto your TradingView chart
A broker emulator or demo account that mirrors your real execution conditions
A trade journal logging every entry and exit in R-multiples, not just dollars
Walk-forward windows that separate in-sample tuning from out-of-sample proof
Your next move: start a paper-trading log and commit to 50–100 real trade attempts, or run several complete walk-forward cycles, before you touch live capital.
Key Takeaways
Forward testing only produces decision-ready results when it combines walk-forward validation, disciplined R-multiple journaling, and realistic execution assumptions before any capital scaling happens.
Point | Details |
Definition first | Forward testing validates a strategy on live data through paper trading or small real size, after backtesting. |
Use R-multiples | Log every trade’s result as a multiple of risk taken, not raw dollars, for real comparability. |
Run walk-forward cycles | Optimize in-sample, test out-of-sample, and roll the window forward to catch overfitting early. |
Set pass/fail rules first | Decide your minimum sample size, expectancy, and drawdown limits before you start testing, not after. |
Simplify signal generation | Big Move Algo’s real-time Long, Short, and Exit signals plus Fake Trend Detector help keep forward-test data clean. |
Table of Contents
Why Forward Testing Matters More Than Your Backtest
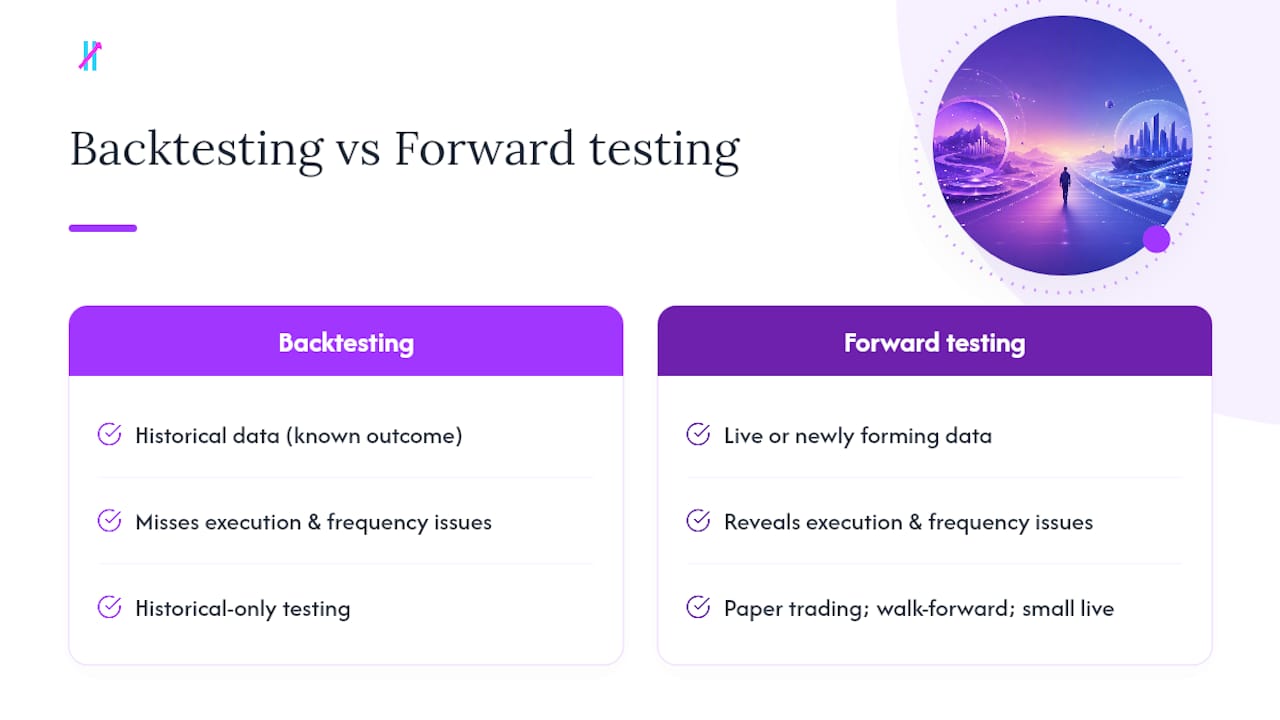
Backtesting tells you whether your logic worked on data you already know the ending to. Forward testing tells you whether that logic still works when you don’t know what happens next. That’s a different question entirely.
A backtest can’t show you slippage on a fast-moving five-minute chart, a stop-loss that’s too tight for real spread conditions, or a signal that fires three times a week in theory but twice a month in practice. Forward testing exposes all three.
Reveals whether your position sizing rules are actually workable in real-time noise
Surfaces platform quirks, order delays, and execution mistakes backtests can’t simulate
Confirms your strategy generates enough tradeable setups to be worth running
Traders who treat forward testing casually, tweaking rules mid-stream or skipping journal entries on “obvious” trades, end up with data too messy to trust. Professional trading programs recommend the opposite: follow your rules exactly, log everything, and treat every simulated trade like it’s real money on the line.
Pro Tip: Set a hard rule before you start: no discretionary overrides during the test window. If you catch yourself skipping a signal because it “feels wrong,” write that down too. That instinct is data.
Walk-Forward Analysis, Paper Trading, or Small-Live: Which Do You Need?
Three methods dominate serious strategy validation, and they’re not competitors. They’re stages.
Walk-forward analysis optimizes your strategy’s parameters on one chunk of historical data (the in-sample window), then tests those exact parameters on the following unseen chunk (out-of-sample). You roll the window forward repeatedly and compile the out-of-sample results. This method traces back to Robert E. Pardo, whose work formalized it as a defense against curve-fitting, and it remains one of the most respected robustness checks in systematic trading.
Paper trading takes over from there. It simulates your strategy against live-data feeds without risking a cent, and it’s where execution problems show up: missed fills, alert delays, or a strategy that simply doesn’t trigger often enough to matter.
Small-live scaling is the final stage, where micro-sized real positions introduce something no simulation can replicate.
Paper trading validates the strategy. Small live size validates you. Real money changes decision-making in ways demo accounts never will.
Backtest the idea across historical data first
Run walk-forward cycles to confirm the edge survives out-of-sample
Paper trade the surviving strategy against live feeds
Move to small real capital only after both stages pass
Skipping straight from backtest to live money is how traders discover, expensively, that their edge was an artifact of overfitting.
How Do You Set Up a Forward Test on TradingView?
TradingView treats backtesting and forward testing as separate, connected processes. Once your strategy is coded, the Strategy Report keeps updating in real time as new bars form, which is what makes forward testing on the platform practical without extra software.
Here’s the setup sequence:
Load a strategy() script (yours or a published one) onto your chart and confirm the order types match your plan: market, limit, or stop.
In the Strategy Tester settings, set your starting capital, currency, and commission assumptions to match your actual broker.
Turn on bar magnifier or higher historical detail if your strategy trades on lower timeframes; this improves fill accuracy inside each bar.
Open a paper-trading account and match its starting balance and leverage to what you’ll actually use live.
Pick a timeframe and instrument that reflect your intended trading style. A scalper testing on daily bars learns nothing useful.
Place every simulated trade manually through the paper account rather than letting the emulator auto-fill, and screenshot each entry and exit.
Pull trade-by-trade data from the Trades tab and aggregate metrics from the Metrics tab after each session.
Beyond the setup, build a routine: check your watchlist each morning, log trades in a standard template the moment they close, and review the full week’s results every Friday rather than judging performance trade by trade.
Pro Tip: Pyramiding and order-fill settings inside Pine Script quietly change your results. A strategy allowed to stack three positions performs very differently from one capped at one, so lock these settings before you start and don’t touch them mid-test. Full mechanics on this live in TradingView’s Pine Script strategy docs, and our own breakdown of the Strategy Tester walks through the Metrics and Trades tabs in more depth.
What Should You Track in Your Forward Test Journal?
Raw profit and loss tells you almost nothing on its own. R-multiples, your gain or loss expressed as a multiple of your initial risk, let you compare a $40 win on a $2,000 account to a $400 win on a $20,000 account. Without that normalization, you’re comparing apples to spreadsheets.
Every trade entry needs these fields at minimum:
Date, time, instrument, and timeframe
Entry price, exit price, and position size
R-multiple result (risk-adjusted, not raw dollars)
Reason for entry and whether you followed the plan exactly
Metric | What It Tells You |
Average R | Whether your typical trade is profitable relative to risk taken |
Win rate | Percentage of trades closed positive, useful only alongside average R |
Expectancy | Average R multiplied by win rate minus average loss on losers |
Max drawdown | Worst peak-to-trough decline your account survived |
Consecutive losses | How many losing trades in a row your plan can absorb |
Expectancy is the number that actually matters for decision-making: a strategy with a 40% win rate and strong average winners can beat one with a 60% win rate and weak ones. Beginners should aim for roughly 50 to 100 trades across varied conditions before drawing conclusions, and multiple walk-forward cycles give you the same statistical footing.
Pro Tip: Add a “plan adherence” column separate from your R-multiple column. A losing trade you executed perfectly is data. A losing trade where you moved your stop is a discipline problem, not a strategy problem, and mixing the two poisons your journal.
How Do You Know if Your Strategy Is Overfit?
An overfit strategy looks brilliant on the data it was built on and falls apart the moment conditions shift. Three checks catch this before it costs you money.
Nudge each parameter slightly (a moving average length from 20 to 18 or 22) and confirm performance doesn’t collapse; real edges tolerate small changes.
Run multiple out-of-sample windows and aggregate the results rather than trusting one lucky segment.
Test across different regimes: a trending market, a choppy range, and a high-volatility news period.
Wild swings between out-of-sample windows, extreme sensitivity to a single parameter, or an equity curve that spikes once and flatlines afterward are all red flags.
A strategy validated across five or more rolled-forward out-of-sample windows with consistent positive expectancy in each is dramatically harder to dismiss as luck than one tested on a single historical stretch. That’s the entire logic behind walk-forward optimization: one good OOS segment proves nothing, but five in a row starts to prove something. For a deeper look at where robustness checks tend to fail, see avoiding overfitting in backtests.
When Should You Move From Paper Trading to Real Money?
Set your pass criteria before you start testing, not after you see the results. Retroactive goalposts are how traders talk themselves into strategies that shouldn’t graduate.
A reasonable pass checklist looks like this:
At least 50 trades or three full walk-forward cycles completed
Positive expectancy that holds across out-of-sample windows, not just in-sample
Maximum drawdown within a range you could stomach with real money
Plan adherence at 80% or higher across the journal
If your strategy clears all four, scale up deliberately:
Start with the smallest position size your broker allows, treating it as tuition, not income.
Increase size only after a defined number of trades perform in line with your forward-test expectancy.
Cap any single strategy at a modest fraction of total trading capital regardless of how well it’s performing.
Expect the emotional experience of real money to differ from paper trading. If your behavior starts drifting from your journaled plan, pause and go back to paper size until discipline returns. If any checklist item fails outright, don’t lower the bar. Extend the test, fix the specific issue, and rerun the count from zero.
Common Forward-Testing Mistakes to Fix Right Now
Most forward tests fail quietly, not dramatically. The strategy looks fine; the process behind it doesn’t.
Sizing positions unrealistically large for the paper account balance
Ignoring slippage and commissions, which flatters results that won’t survive contact with a real broker
Testing only in favorable trending conditions and skipping choppy or volatile stretches
Changing entry or exit rules partway through the test instead of finishing the current run first
Troubleshooting these is mostly mechanical: add conservative slippage and fee assumptions to your Strategy Tester settings, widen your sample size if results look thin, and standardize every journal entry with the same fields every time.
Watch for TradingView emulator limitations like bar-close-only fills on lower timeframes; enable bar magnifier when your strategy depends on intrabar precision.
Never assume paper P&L feels the same as real P&L. Schedule short live micro-tests specifically to build tolerance for that difference before scaling.
A Practitioner’s Take on Running Forward Tests
Treat forward testing like it’s already live trading, because psychologically, it should be. The traders who skip this mental step end up with clean-looking demo results and a very different relationship to real losses.
A workable rhythm: backtest for the idea, walk-forward for the proof, paper trade with strict R-multiple journaling for the confirmation, then micro-live for the emotional gut check. Set a sample-count or calendar stop before you begin. Testing forever isn’t rigor. It’s avoidance.
How Big Move Algo Fits Into Your Forward-Testing Workflow
Running a clean forward test gets a lot easier when your signal generation isn’t the variable you’re second-guessing. Big Move Algo is a TradingView indicator built to hand you clear Long, Short, and Exit signals in real time, so your journal tracks execution and risk management instead of arguing with ambiguous chart patterns.

AUTO Mode gets you generating testable signals with almost no configuration, which matters when you’re trying to log 50 to 100 clean trades without spending your first three weeks tuning settings. Manual Mode gives more experienced traders room to adjust parameters for their own walk-forward cycles. The built-in Fake Trend Detector flags choppy, low-quality conditions before you take a signal into paper trading, which cuts down on the noisy, inconsistent entries that make journal data hard to trust. It runs across crypto, forex, stocks, indices, and commodities, and works on unlimited devices, so your forward test on one instrument doesn’t lock you out of testing another.
If you’re ready to run a structured forward test with signals you don’t have to second-guess, check out Big Move Algo and start logging trades this week.
Frequently Asked Questions
What’s the difference between backtesting and forward testing? Backtesting runs your strategy against historical data you already know the outcome of. Forward testing runs it against live or newly forming data in real time, exposing execution issues and signal frequency problems a backtest can’t show you.
How many trades do I need before trusting a forward test? Aim for 50 to 100 trade attempts or multiple complete walk-forward cycles. Fewer than that, and a short winning or losing streak can look like a real edge when it’s just noise.
Can I forward test on TradingView without coding? Yes. You can load a published strategy or indicator, use the paper-trading broker emulator, and track results through the Strategy Report’s Metrics and Trades tabs without writing a line of Pine Script.
Is paper trading the same as forward testing? Paper trading is one form of forward testing. Forward testing more broadly includes walk-forward analysis and small-size live trading, with paper trading as the no-risk middle stage between the two.
This article is general information, not a substitute for advice from a qualified financial advisor. Consult a qualified financial professional about your own circumstances before acting on anything here.
Sources
Recommended
Comments