
A Price Action Trading Indicator Turns Bars Into Signals
- Steven Hartwell

- Aug 24
- 12 min read

A price action trading indicator is a script that reads raw bar-by-bar structure, closes, wicks, ranges, and translates that structure into an on-chart signal you can act on without staring at every candle yourself. You’ll see it used three ways: confirming live entries, validating that market structure is actually intact before you trust a setup, and filtering noise on charts crowded with too much data.
The practical recommendation is simple, and most traders ignore it: limit yourself to two or three indicators total, not seven. A pure price action approach reads the chart with minimal indicator bias in the first place, so stacking a dozen tools on top defeats the purpose. If you want a vetted starting point that handles the filtering for you, a TradingView indicator like Big Move Algo generates Long, Short, and Exit signals in real time while screening out weak setups before they reach your chart.
Here’s what that looks like in practice:
Structure validation: confirm a trend or range is real before entering
Entry timing: get a signal the moment bar structure meets your rules
Noise filtering: strip out the setups that look tradable but aren’t
Exit discipline: know when structure has broken enough to close the trade
Key Takeaways
Price action indicators work best when limited to two or three tools total, with one primary structure signal confirmed by one momentum or volatility filter before any trade is placed.
Point | Details |
Pick one primary signal type | Choose a trend, pattern, or volatility based indicator as your main structure read. |
Pair with one confirmation | Add a momentum tool like RSI or MACD, never more than two to three tools total. |
Validate before entering | Check volume, multi-timeframe agreement, and session liquidity before trusting a signal. |
Set stops by structure, not round numbers | Place stops beyond the signal bar’s tail or recent swing point, with an ATR buffer on volatile symbols. |
Big Move Algo automates the filtering | Its Fake Trend Detector and AUTO/Manual modes on TradingView deliver filtered Long, Short, and Exit signals across crypto, forex, stocks, indices, and commodities. |
Table of Contents
Types of Price Action Indicators and How They Read the Chart
Not every price action indicator does the same job. They split into four rough categories, and knowing which one you’re looking at changes how you should use it.
Trend-based indicators watch the slope and sequence of bars, often layering an EMA or a structure filter (higher highs and higher lows, or the reverse) on top of raw price. When a trend indicator fires, it’s telling you the market has committed to a direction, not that a reversal is coming. These tend to lag by design, since they need a few bars of confirmed movement before they’ll commit to a signal.
Pattern detectors are the closest thing to classic price action in its purest form. They scan for inside bars, outside bars, and single-bar reversal setups, then map those shapes to the setups traders have used for decades: the pin bar reversal, the inside bar breakout, the outside bar engulf. TradingView hosts dozens of scripts built around exactly this logic, many of them descended from Al Brooks’s bar-counting rules, with strict thresholds on bar size and close location built in to cut down on false reversals.
Volatility and range tools don’t generate directional signals on their own. Bollinger Bands, Keltner Channels, and ATR measure how much room price has to move, and traders use them as context: is this a breakout with real expansion behind it, or a low-volatility chop that will fake you out?
Momentum and confirmation tools like RSI and MACD exist to answer one question: does the move have strength behind it, or is it running out of steam? These work best as a second opinion, not a primary signal.
One useful historical footnote: the PriceActionIndicator built into thinkorswim, originally developed by Michael B. Garety back in 1997, calculates intraday momentum along with late buying and late selling pressure directly from OHLC data. It outputs a numeric series that lines up with classic candlestick signals, which shows this isn’t a new idea. Traders have been trying to quantify bar-by-bar pressure for almost 30 years. What’s changed is the platform: Saxo’s guide to popular indicators covers the same core categories (SMA/EMA for trend, MACD and RSI for momentum, Bollinger and ATR for volatility) now built natively into TradingView and thinkorswim, ready to drag onto a chart in seconds.
Here’s a quick reference for how these categories stack up:
Trend-based: EMA crossovers, structure filters. Lag by nature, best for confirming direction.
Pattern detectors: inside/outside bars, pin bars. Fast but prone to false signals in choppy markets.
Volatility/range: Bollinger, Keltner, ATR. Context tools, not standalone signal generators.
Momentum/confirmation: RSI, MACD. Best paired with a structure or pattern tool, never used alone.
How to Build a Trade Around a Price Action Signal
A signal without an entry rule is just a notification. Here’s how to turn a price action indicator into an actual trade plan.
Start with the bar itself. Sloppy bars with long wicks and small bodies in the middle of the range are the ones that fake you out.
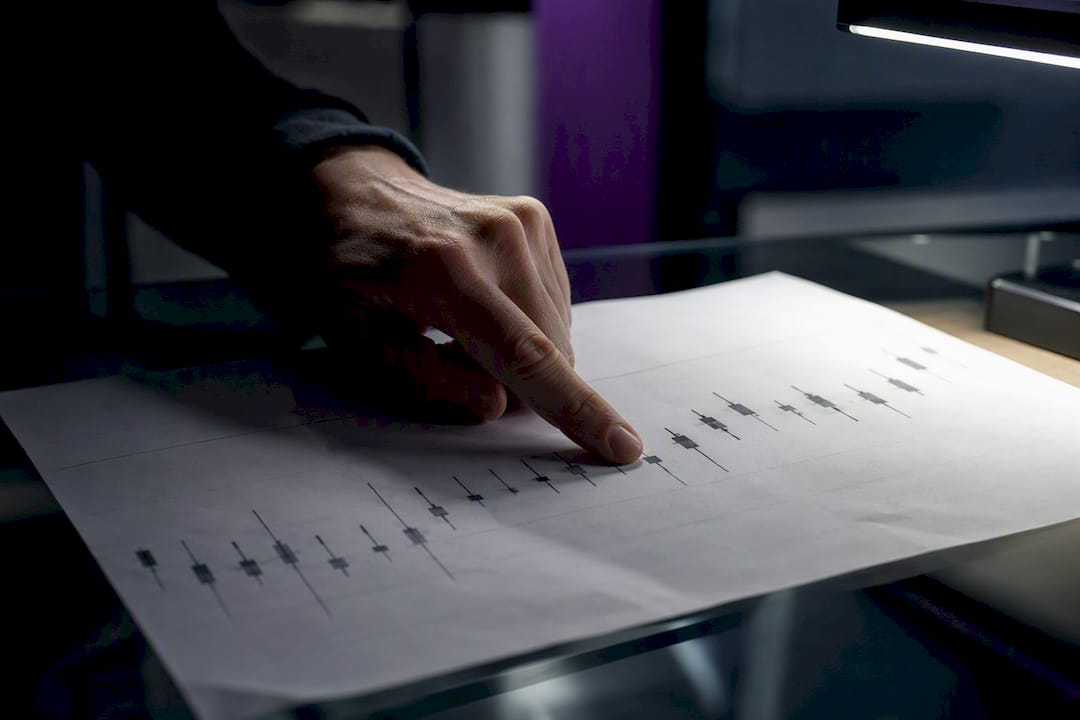
Stop placement follows the same logic. Put your stop beyond the tail of the signal bar or the recent swing point that defines the structure, not at some arbitrary round number. If you’re trading a volatile instrument like crypto or a commodity with wide intraday swings, add an ATR-based buffer, typically 0.5 to 1.0 times the current ATR, so normal noise doesn’t stop you out before the move even starts.
Targets have three common approaches:
Structure targets: the next swing high or low, or a prior consolidation zone
Fixed risk-to-reward: a flat 2:1 or 3:1 multiple of your initial risk
Trailing by structure: moving your stop up (or down) as each new bar confirms the trend is intact
Timeframe matters more than most beginners realize. On a 5 to 15 minute chart, you’re trading intraday noise and need tighter stops and faster exits. On a 1 hour or daily chart, the same signal type carries more weight because it took longer to form, and you can afford wider stops with correspondingly larger targets. Crypto markets run 24/7 with no session breaks, so structure can build differently than in forex, which has clear session opens and closes that often mark real turning points.
Before you trust any signal, run three quick checks: is volume behind the move consistent with the bar’s size, do the higher and lower timeframes agree on direction, and does a fake-trend filter (if your indicator has one) confirm the move isn’t just a liquidity grab?
Pro Tip: *Backtest your exact entry rule, not a vague version of it. “Enter on a strong bullish bar” is untestable.
Pairing Indicators Without Triggering Analysis Paralysis
The single most common mistake in price action trading isn’t picking a bad indicator. It’s picking six good ones and letting them argue with each other on the same chart. Investopedia’s review of top technical analysis tools makes the case plainly: combining a trend tool with a momentum oscillator strengthens your read on the market, but stacking more than two or three tools tends to create contradictions rather than clarity.
Two pairings cover most trading styles:
Trend structure + momentum: an EMA or structure filter to establish direction, paired with RSI or ADX to confirm the move has strength. Use this on trending markets, forex majors during active sessions, trending crypto pairs, or stocks in a clear uptrend or downtrend.
Volatility + momentum: Bollinger Bands to flag when price is stretched, paired with MACD or RSI to confirm momentum is turning. Benzinga’s breakdown of effective indicator combinations specifically points to Bollinger Bands plus RSI or ADX as a reliable way to sharpen entry timing, particularly around range boundaries.
The sequence matters as much as the pairing. Run it as signal, then confirmation, then execution: your price action indicator fires a setup, your second tool either confirms or contradicts it, and only a confirmed signal gets a live order. If the two disagree, skip the trade. That’s not a failure of the system, it’s the system doing its job.
Timeframe alignment trips people up here too. If your price action signal fires on the 15 minute chart, check your momentum confirmation on the same timeframe or one step higher, never a lower one. A guide to slimming down conflicting indicator sets walks through exactly how to audit a cluttered chart and cut it back to a workable pair.
The Indicator Trap and How False Signals Sneak In
More indicators do not mean more clarity. Past two or three tools, you hit what traders call the indicator trap: every new tool adds one more opinion, and eventually you’re not trading, you’re arbitrating a committee meeting on your own chart. Conflicting signals from an overloaded chart are one of the fastest ways to turn a decent setup into a hesitation that costs you the entry entirely.
Low-quality signals cluster around specific conditions you can filter for directly:
Thin sessions: signals fired during low-volume hours (holiday trading, the lunch lull in equities) carry less weight
Volume mismatches: a breakout bar without volume behind it is a weak breakout, regardless of shape
Context errors: taking a trend-following signal in a market that’s actually ranging, or a range-based signal in a market that just broke trend
That last one is the quiet killer. A pattern detector tuned for range conditions will misfire constantly in a trending market, because it keeps calling reversals against a trend that has no intention of reversing.
Practical filters solve most of this. A fake-trend detector that specifically screens for low-quality trending conditions catches a real category of failure that pattern rules alone miss. Multi-timeframe agreement (checking that your signal’s direction matches the next timeframe up) cuts a meaningful share of false positives. Session-based gating, simply turning signals off during known low-liquidity windows, removes an entire class of bad trades before they happen.

Pro Tip: If you find yourself checking four indicators before every trade and still can’t pull the trigger, that’s not caution. That’s the indicator trap. Cut back to two tools and a hard rule for what counts as agreement.
Setting Up a Price Action Indicator on TradingView
Getting a price action indicator running on TradingView takes about ten minutes if you follow this order.
Pick your timeframe and a demo symbol first. Don’t tune settings live on your actual trading account. Load a liquid symbol you know well (a major forex pair, a large-cap stock, or a top crypto pair) on the timeframe you actually intend to trade.
Tune the core inputs. Most price action scripts expose a lookback period (how many bars define “recent structure”), EMA lengths if a trend filter is built in, an ATR multiplier for stop or buffer calculations, and a signal sensitivity threshold. Start with default settings, log a week of signals, then adjust one input at a time.
Set up alerts. Right click the chart, choose “Add Alert,” and select the indicator’s specific alert condition rather than a generic price cross. Most price action scripts let you fire separate alerts for Long, Short, and Exit conditions. For basic automation, point the alert at a webhook URL if you’re connecting to a broker or automation platform. A full walkthrough of setting up buy/sell alerts covers the webhook configuration step by step.
Troubleshoot from there. No signals firing usually means your sensitivity threshold is set too tight for the symbol’s typical range. Too many signals means the opposite, or you’re on a timeframe too low for the strategy. And if signals seem to “disappear” after they print, check whether the script repaints, meaning it recalculates historical bars based on data unavailable at the time. Repainting scripts can look great on a backtest and fail live, so verify this before you trust any signal history.
Why Big Move Algo Handles the Filtering Layer for You
Everything covered so far, bar validation, stop logic, indicator pairing, false-signal filtering, is exactly what Big Move Algo was built to automate on top of. It runs as a TradingView indicator and outputs direct Long, Short, and Exit signals rather than raw data you have to interpret yourself.
The feature set maps directly onto the problems this article has walked through:
Fake Trend Detector: screens out the low-quality trending conditions that generate false pattern signals, the same context error covered in the mistakes section above
AUTO Mode: minimal setup for traders who want filtered signals without tuning a dozen inputs manually
Manual Mode: full customization for traders who want to adjust sensitivity and structure rules themselves
Cross-market coverage: works across crypto, forex, stocks, indices, and commodities, so the same signal logic applies whether you’re trading a 15 minute crypto chart or a daily forex swing
Unlimited devices and alert delivery: signals reach you wherever you’re set up to trade, with support for integration into automated trading platforms
The core problem with most price action tools isn’t that they lack signals. It’s that they generate signals without telling you which ones to trust. A fake-trend filter exists specifically to answer that question before you risk capital on it.
Access runs through a straightforward subscription, with payment processed via Stripe and instant access to the indicator on TradingView after checkout. If you want to manage which TradingView account is linked to your subscription, that’s handled directly through your account settings.
What Most Traders Get Backward About Price Action
Most guides treat price action as a purity contest: fewer indicators equals more skill, and the “real” traders read naked charts. That’s overcorrection dressed up as discipline. Reading bar structure with zero context is just as error-prone as drowning it in seven overlapping tools, because a bar’s shape means something different in a trend than it does in a range, and no chart tells you which regime you’re in without at least one confirming input.
The advice that actually holds up is narrower: one structure signal, one confirmation, applied consistently, backtested honestly. That’s not a compromise between the “pure price action” camp and the “load up on indicators” camp. It’s the only version of either approach that survives contact with live markets.
Where retail traders go wrong most often isn’t indicator choice. It’s inconsistency, tuning settings after a losing week instead of after a proper sample size, or abandoning a valid setup because three trades in a row felt wrong. A filtered signal, whether you build it yourself or run something like Big Move Algo’s Fake Trend Detector underneath it, only helps if you actually follow it through a full sample of trades before judging it.
Get Filtered Signals Without Building Your Own Ruleset
Everything in this article, bar validation, stop placement, indicator pairing, false-signal filtering, is the manual version of what Big Move Algo runs automatically on your chart. Instead of tuning a pattern detector, a momentum confirmation, and a fake-trend filter separately and hoping they agree, you get one indicator that already does the filtering and outputs a direct Long, Short, or Exit signal.

It suits traders who want the practical setups covered above without spending weeks backtesting their own rule combinations. AUTO Mode gets you filtered signals with minimal configuration; Manual Mode lets you adjust sensitivity once you know what you’re looking for. It runs across crypto, forex, stocks, indices, and commodities, and supports unlimited devices so the same signal set follows you from desktop to mobile.
If you’re switching devices or need your subscription pointed at a different TradingView account, you can manage that directly in a couple of clicks, with instant access restored the moment it’s linked.
Frequently Asked Questions
What is the best price action trading indicator for beginners?
There’s no single indicator that fits every beginner, but the best starting point is one that combines a clear signal with built-in filtering, rather than raw pattern detection you have to interpret alone. Look for tools with an AUTO or simplified mode so you’re not tuning ten inputs before your first trade.
Can a price action indicator replace manual chart reading?
No, and it shouldn’t try to. Even the most refined indicator still benefits from a trader who understands why a signal fired, since context (trend versus range, session liquidity, higher timeframe structure) is something even a good filter can only partially automate.
How many indicators should I use for price action trading?
Two to three total, according to Investopedia’s analysis of technical analysis tools: one primary structure or pattern signal, plus one or two confirmation tools like a momentum oscillator or volatility filter. Beyond that, signals start contradicting each other more than they clarify anything.
Do price action indicators work the same way in forex and crypto?
The underlying bar logic is the same, but market behavior differs. Forex has defined sessions that often mark real structural turns, while crypto trades 24/7 with less predictable liquidity cycles, so the same signal may need a wider ATR buffer or a stricter session filter depending on the market.
What’s the difference between a leading and a lagging price action indicator?
Pattern detectors (inside bars, pin bars, reversal setups) tend to be leading, flagging a potential turn as it forms. Trend-based and moving-average style indicators are lagging by design, confirming a direction only after several bars support it. Most traders use one of each, not two of the same type.
Sources
Recommended
Comments