
Best Exit Indicators for Day Traders That Protect Profits
- Steven Hartwell

- Aug 18
- 12 min read

The best exit indicators for active traders combine a volatility-adjusted trailing stop with a momentum filter, rather than relying on a single line on a chart. The most reliable setup pairs a Chandelier Exit or ATR-based trailing stop with RSI confirmation, and adds a trend filter so you’re not exiting into noise.
Here’s the shortlist that actually earns a spot on your chart:
ATR trailing stop or Chandelier Exit — the backbone for trend trades; keeps you in the move while protecting gains.
SuperTrend — a simpler visual version of the same volatility logic, good for fast reads.
Moving average crossovers — best as a slower confirmation layer, not a standalone trigger.
RSI momentum thresholds — catches exhaustion before price action confirms it.
Volatility-regime filters — exit when volatility cools after a minimum hold, avoiding premature exits on quiet pullbacks.
The one rule to start with today: set an ATR-based trailing stop at 1.5 times the 14-period ATR, confirm with RSI, and scale out two partial exits at 1R and 2R. That single template removes most of the guesswork that costs retail traders their gains.
Key Takeaways
Rule-based exits built from volatility-adjusted trailing stops and momentum confirmation outperform discretionary guessing because they remove hesitation at the exact moment it costs the most money.
Point | Details |
Start with ATR trailing stops | Set the stop at 1 to 1.5x the 14-period ATR beyond a key level for volatility-matched exits. |
Confirm before you act | Pair any threshold signal like RSI with a trend or volatility filter to cut false exits. |
Scale out instead of guessing | Exit 25 to 50% at your first target and move the remaining stop to breakeven. |
Match the tool to the timeframe | Use tighter, faster indicators for scalping and wider trailing stops for swing trades. |
Test before you trust | Paper-test any new exit template across multiple market conditions before going live. |
Automate the discipline | Big Move Algo’s AUTO Mode and Fake Trend Detector apply these same exit rules without manual monitoring. |
Table of Contents
What Exit Indicators Actually Do for Your Trades
An exit indicator is a rule, expressed visually or numerically, that tells you when to reduce or close a position instead of leaving that decision to gut feel. It doesn’t predict the future. It reacts to price, volume, or volatility data you already have, and converts that data into a specific action: sell now, sell part now, or tighten your stop.
Exit indicators generally serve three jobs on your chart:
Fixed exits — a predetermined price target or stop distance set at entry, unaffected by what happens after.
Trailing exits — a moving stop that follows price and locks in gains as a trend extends.
Conditional or exhaustion exits — a signal that fires when momentum, volatility, or a pattern suggests the move is running out of steam.
What they don’t do matters just as much. No exit indicator reliably marks the exact top or bottom of a move. RSI can sit above 70 for days in a strong trend. A trailing stop will always give back some profit compared to a perfect exit, because that’s the cost of staying in the trade long enough to catch the move in the first place.
Exits exist to protect gains, not to call the top. Alexander Elder’s trading rules stress that the exit decision should track your risk tolerance and timeframe, not your hope for a perfect print. A trailing stop that’s too tight for your timeframe will chop you out of good trades; one that’s too loose will erase profits you already earned.
That’s the mental shift worth making before you touch a single setting: an exit indicator’s job is risk management, not fortune telling.
How Exit Signals Actually Get Generated
Most exit signals fall into three mechanical categories, and understanding which one you’re looking at changes how you should react to it.
Threshold signals fire when a value crosses a fixed line. RSI above 70 or below 30 is the classic example. The signal is binary and immediate, but it says nothing about how long the condition will persist.
Crossover signals fire when two lines intersect, most often a fast moving average crossing a slow one, or price crossing a single moving average. These lag by design because they need confirmed data on both sides of the cross.
Trailing stop signals move with price and fire only when price reverses far enough to touch the stop line. ATR-based trails, Chandelier Exit, and SuperTrend all work this way.
Picture a trending stock: you enter on a breakout, the trend runs, and each of these three signal types behaves differently as the trade develops. A threshold signal (RSI) might flash exhaustion at day three while the stock keeps climbing for another week; a crossover signal (20/50 MA cross) stays quiet until the trend actually breaks, arriving late but rarely wrong; a trailing stop (ATR at 1.5x multiplier) tightens automatically as the trend extends, giving back a defined slice of profit but never asking you to guess.
Common parameter choices and what they mean for trade management:
RSI set to exit above 70 (long) or below 30 (short) — works best in range-bound conditions, produces false signals in strong trends.
20/50 moving average cross — smooths out noise but can lag a fast reversal by several bars.
ATR (14) with a 1.5x to 3x multiplier — tighter multipliers suit choppy stocks, wider multipliers suit strong trending assets like Ideas suggests, where volatility tends to persist in clusters rather than resetting randomly.
Ranked List of the Best Exit Indicators
Every indicator below has a specific job. Some are fast and jumpy, built for scalping. Others are slow and steady, built to ride a swing trade to its conclusion. Matching the tool to your timeframe matters more than which one you pick.
Indicator | Best for | Signal type | Typical timeframe | Sensitivity/lag | Confirmation needed |
Moving averages/crossovers | Trend-following | Crossover | Swing, day | Slow/lagging | Volume or ADX |
RSI | Mean-reversion | Threshold | Scalp, day | Fast/leading | Trend filter |
MACD | Trend-following | Crossover | Day, swing | Moderate lag | Histogram divergence |
Bollinger Bands | Mean-reversion | Threshold | Day, swing | Moderate | Volume confirmation |
Stochastic Oscillator | Mean-reversion | Threshold | Scalp, day | Fast/leading | Trend filter |
Fibonacci retracement | Trend-following | Price level | Swing | Static, no lag | Price action confirmation |
ATR/Chandelier Exit | Trend-following | Trailing stop | Day, swing | Adaptive | None required |
SuperTrend | Trend-following | Trailing stop | Day, swing | Adaptive, fast | ADX helpful |
Support & Resistance | Both | Price action | All timeframes | Discretionary | Volume, candle pattern |
Big Move Algo | Both | Threshold + trailing | Scalp, day, swing | Adaptive | Fake Trend Detector built in |
Moving averages and crossovers work well as a slower filter that confirms a trend is intact, but relying on a 20/50 cross alone means you’ll exit late almost every time. RSI shines at catching momentum exhaustion in range-bound markets, less so in a strong trend where it can stay overbought for weeks. MACD gives you histogram divergence as an early warning that momentum is fading before the price actually turns. Bollinger Bands flag stretched moves when price tags the outer band, useful for scaling out partial size rather than exiting everything at once.
Stochastic Oscillator behaves like a faster cousin of RSI, better suited to scalping timeframes where quick reversals matter. Fibonacci retracement levels give you static price targets to scale out into, especially the 61.8% and 78.6% zones traders watch for reversals. ATR-based stops and the Chandelier Exit anchor your trailing stop to the highest high minus a multiple of ATR, which the Enlightened Stock Trading breakdown frames as a stop-management tool first, not an entry signal. SuperTrend delivers a similar volatility-adjusted trail in a simpler visual package, flipping color when the trend reverses.
Support and resistance / price action exits rely on your own read of the chart rather than a formula, which makes them powerful but inconsistent unless you pair them with a rule (like exiting on a close below the prior swing low). Big Move Algo covers this ground differently: it issues an explicit Exit signal generated from its own blended logic, filtered through a built-in Fake Trend Detector that screens out low-quality setups before they ever reach your chart.
Two quick trade walk-throughs show how these stack together:
Trend trade: Enter long on a 20/50 MA cross. Trail the stop with Chandelier Exit at 3x ATR. RSI drops from 78 to 55, a warning sign, but the stop doesn’t fire until price actually closes below the trail line two days later, locking in most of the run.
Range trade: Enter short at resistance confirmed by a Fibonacci 61.8% level. RSI is above 70. Exit triggers when Stochastic crosses back below 80, well before price reaches the prior swing low, capturing the mean-reversion move cleanly.
Building an Executable Exit Plan by Timeframe
Rules only work if you write them down before you’re in the trade, not while you’re staring at an open position wondering what to do. Here’s how the numeric settings above map to three common trading styles.
Timeframe | Primary exit tool | Stop shape | Target shape |
Scalp (minutes) | RSI/Stochastic threshold | Fixed tick or — | 1R fixed target |
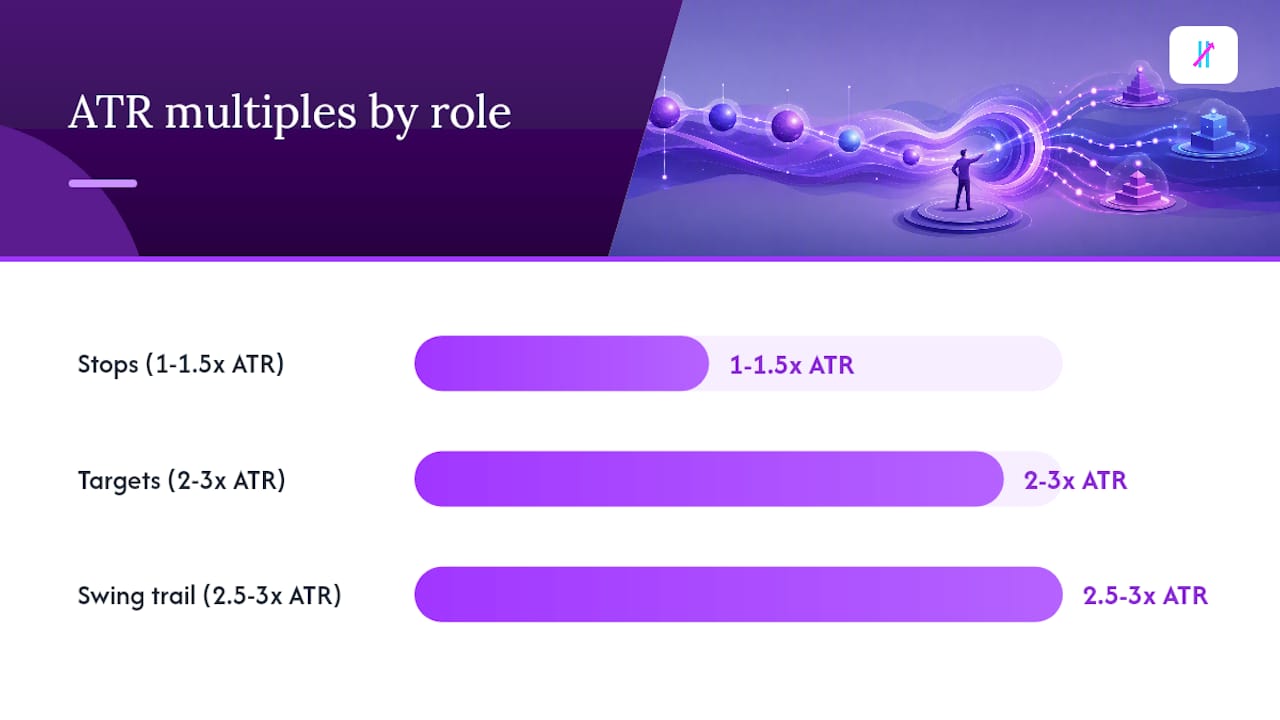
Day trade | ATR trailing stop | 1 to 1.5x ATR trail | Scale out at 1R, 2R |
Swing trade | Chandelier Exit/SuperTrend | 2.5 to 3x ATR trail | Trail full position |
For an intraday scalp, the if-then template is tight: if RSI crosses back below 70 after an overbought long entry, exit the full position immediately, because scalping timeframes don’t leave room for a slow trailing stop to catch up.
For a day trade, use two steps: if price closes below a 1.5x ATR trail, exit 50% of the position and move the stop to breakeven on the remainder; if the second half then hits the same trail again, exit fully. This locks in a chunk of profit early while leaving room to ride a stronger move.
For a swing trade, widen everything: if price closes below the Chandelier Exit set at 2.5x to 3x ATR, exit the entire position, since swing trades need room to breathe through normal pullbacks that would stop out a tighter intraday rule. The practical guide to ATR-based sizing recommends stops at 1 to 1.5x ATR beyond a key level and targets at 2 to 3x ATR, which scales cleanly across all three timeframes above.
Pro Tip: Write your if-then rule on a sticky note before you enter the trade. If you can’t state your exit condition in one sentence before you click buy, you don’t have a plan yet, you have a guess.
Combining Indicators to Cut Down False Exits
No single indicator survives every market condition. Combining two or three into a confirmation stack is how experienced traders avoid getting whipsawed by noise while still reacting fast enough to protect real gains.
ATR trailing stop + RSI momentum filter + higher-timeframe MA bias. The trail handles the mechanical exit, RSI flags early exhaustion, and the higher-timeframe moving average tells you whether you’re fighting the larger trend. This stack, similar to the adaptive filter approach in Chandelier Exit Trend Navigator, reduces false exits specifically in choppy, directionless markets.
Moving average crossover + volume spike + Bollinger Band contraction. The crossover confirms direction, the volume spike confirms conviction, and a Bollinger squeeze beforehand tells you the move likely has real fuel behind it rather than being a random spike.
SuperTrend + ADX threshold + scale-out rule. SuperTrend gives you the trailing line, ADX above 25 confirms you’re actually in a trend worth trailing, and a scale-out rule (25% at 1R, 25% at 2R, trail the rest) locks in partial profit regardless of what happens next.
Building your own stack means following a few guardrails. Keep it to two or three indicators; a fourth rarely adds real information and mostly adds lag. Test each layer’s contribution separately before combining them, because a stack that looks great in aggregate sometimes owes its performance to one indicator carrying the rest. And resist the urge to tune every parameter to match your last ten trades, since that’s how a robust rule turns into a fragile one.
Never add a confirmation filter you can’t explain in one sentence.
Re-test the stack on a different instrument before trusting it on your main one.
If a filter rejects more than half your signals, it’s probably too strict for the timeframe.
Pro Tip: A tighter confirmation stack works in fast, liquid markets like major forex pairs; a looser one works better on volatile small-cap stocks where you need to survive normal noise without getting shaken out.
Common Exit Mistakes and How to Fix Them
The gap between a good exit strategy and a good trader executing it is almost always behavioral, not technical. These are the mistakes that show up most often.
Chasing signals — jumping on an exit alert well after the move already happened, then chasing the next entry to make up for it.
Ignoring the volatility regime — using the same ATR multiplier in a calm market and a violent one.
Relying on one indicator with no confirmation — treating RSI alone as gospel when it disagrees with price action.
Moving stops emotionally — widening a stop because you don’t want to take the loss, rather than because the setup changed.
Over-optimizing parameters — curve-fitting RSI or MA settings to the last twenty trades until the rule stops working on anything new.
For each of these, there’s a specific fix, not just a warning:
Instead of chasing a late signal, accept the missed exit and wait for the next clean setup.
Instead of using one ATR multiplier everywhere, widen it during high-volatility periods and tighten it during quiet ones, as the Hawkes Volatility Exit Indicator does by tracking volatility percentiles directly.
Instead of trusting a single indicator, require at least one confirmation layer before acting on any exit signal.
Instead of moving your stop-loss further away, scale out 25% at your target and move the remaining stop to breakeven.
Instead of re-optimizing after every losing streak, commit to a rule set for a fixed number of trades before changing anything.
Before you hit the exit button, run this quick checklist: Does the signal match the timeframe I’m trading? Is there a second confirming indicator? Am I reacting to the setup or to my own anxiety? If you can answer all three honestly, the exit is probably a good one.
Three Exit Templates With Exact Numbers
Rules with real numbers are what separate a trading plan from a trading vibe. Here are three you can copy directly, along with how each maps onto automated tools like Big Move Algo.
Intraday trailing-stop template: Enter on confirmed breakout. Set trailing stop at 1x ATR (14). Exit fully when price closes beyond the trail. Target R-multiple: 1.5R to 2R on a fast intraday move.
Day-trade scale-out template: Enter with initial stop at 1.5x ATR. Scale out 50% at 1R, move stop to breakeven. Scale out the remaining 50% at 2R or on a Chandelier Exit trigger, whichever comes first.
Swing-trade chandelier template: Enter on trend confirmation (MA cross plus ADX above 25). Trail full position with Chandelier Exit at a higher ATR multiple appropriate for swing trades. No fixed target, let the trail manage the exit through the swing.
Here’s where automation earns its place. In AUTO Mode, Big Move Algo generates the Long, Short, and Exit signals for you using its own blended logic, which suits the intraday and day-trade templates above where speed matters more than manual tuning. MANUAL Mode lets more experienced traders adjust sensitivity toward the swing template’s wider trail, closer to how the Chandelier Exit Trend Navigator layers in higher-timeframe bias and ADX gating on top of a base trailing stop.
The Fake Trend Detector built into Big Move Algo does the job the “ADX filter” does in template three, screening out weak, directionless conditions before a signal ever reaches your chart, which directly addresses the signal-chasing failure mode that trips up traders acting on every alert regardless of trend strength.
Treat every new exit rule as a hypothesis until it’s survived contact with real (or paper) trades across more than one market condition. A rule that only works in a calm uptrend isn’t a rule, it’s a coincidence.
Before committing real capital to any of these templates, paper-test them for at least a few weeks across the specific instruments you trade. Volatility behaves differently in crypto than it does in large-cap equities, and a 1.5x ATR multiplier that works fine on a forex pair can whipsaw you constantly on a volatile altcoin.
Discipline Is the Real Edge, Not the Indicator
The best-performing traders aren’t the ones with the most exotic indicator stack. They’re the ones who pick a rule and actually follow it on trade after trade, even when the last three exits felt wrong. Every backtest looks clean; every live trade tempts you to override the rule “just this once.” That gap between the plan on paper and the plan under pressure is where most retail accounts actually lose money, not in the indicator choice itself.
What I’d push you to do this week: pick one exit template from this article, commit to it for the next 30 trades without modification, and log every deviation you’re tempted to make but don’t. You’ll learn more about your own trading psychology from that log than from switching indicators for the tenth time. Systemized exits work precisely because they remove the moment of doubt, the same moment where discretionary traders talk themselves into holding a loser or cutting a winner short.
Big Move Algo: Clear Exit Signals Without the Guesswork
Big Move Algo is the exit-discipline shortcut for traders who’ve read every rule in this article and still find themselves hesitating at the moment that matters. It runs directly on TradingView and issues explicit Long, Short, and Exit signals in real time, across crypto, forex, stocks, indices, and commodities, so you’re not manually watching ATR bands and RSI thresholds across five charts at once.

AUTO Mode maps almost exactly onto the intraday and day-trade templates covered above, generating signals with minimal setup so you can start applying rule-based exits the same day. MANUAL Mode gives more experienced traders the customization to lean toward the swing-trade chandelier approach, adjusting sensitivity for longer holds. The built-in Fake Trend Detector does the confirmation-filter work automatically, flagging the choppy, low-quality conditions where none of the templates in this article would perform well anyway.

Big Move Algo alerts you across multiple platforms and works on unlimited devices, so the exit signal reaches you whether you’re at your desk or away from it. If you’re ready to stop manually tracking ATR multiples and RSI crosses across separate indicators, visit the Big Move Algo landing page to see current subscription options, and paper-test the signals against your own trading style before committing real capital.
Sources
Chandelier Exit Explained: Smarter Trade Exits Made Simple
Recommended
Comments