
Market Regime Filter: SMA+ATR Method for Systematic Traders
- Steven Hartwell

- Aug 15
- 12 min read

A market regime filter is a rule that enables, disables, or scales your strategy based on inferred market state. The simplest working version: go long only when the SMA(50) slope is positive AND the ATR(14)% is below its 100-day moving average. That single rule, documented by QuantMonitor, keeps a momentum system active almost exclusively during calm uptrends.
Primary benefit: Drawdown control. Sitting out choppy, high-volatility regimes is where most of the damage happens.
Primary cost: Reduced opportunity. You will miss some valid trades, and a few of them will be winners.
The rest of this guide covers the components, formulas, coding patterns, backtest interpretation, and testing discipline you need to deploy a filter you can actually trust.
Key Takeaways
A market regime filter reduces drawdown by keeping your strategy active only in conditions where its edge historically holds, at the cost of fewer trades and occasionally missed rallies.
Point | Details |
Core rule | SMA(50) slope positive AND ATR(14)% below its 100-day MA is the baseline filter to test first. |
Drawdown impact | HMM-based filters cut max daily drawdown significantly in QuantStart’s documented example. |
Minimum trade count | Keep at least 30 trades in the filtered out-of-sample period or results lack statistical meaning. |
Hysteresis window | Require 3–5 bars of confirmation before a regime change takes effect to prevent flip-flopping. |
Big Move Algo | The built-in Fake Trend Detector automates regime gating inside TradingView without custom code. |
Table of Contents
What a market regime filter actually does
The formal term in quantitative finance is state-dependent risk control. A regime filter does not change your entry logic. It decides when your strategy runs and at what size. That distinction matters: the filter preserves your edge by keeping it out of conditions where it historically breaks down.
Three operational decisions a filter can make:
Enable/disable (binary gate): Signals fire only when the filter is green. No signal fires in a red regime.
Scale exposure: Full size in a favorable regime, half size in a borderline one, zero in a hostile one.
Close or cancel at order time: A trade-time risk manager that cancels pending orders or closes open positions when the regime flips mid-trade.
When to add one. Buy-only momentum systems are the clearest case. They tend to bleed badly during sustained bear markets or high-volatility chop because their edge depends on trending, calm conditions. Breakout systems have the same vulnerability. If your backtest shows large drawdowns concentrated in specific market environments, a regime filter is the right tool. If your strategy requires continuous exposure or runs at very high trade frequency, a filter may hurt more than it helps.
FXStreet documents the operational logic traders use to avoid new entries: unstable volatility, poor liquidity, multiple overlapping exposures to the same theme, and major announcements pending. A regime filter automates exactly that checklist.
The core components of a regime filter
Every regime filter is built from at least one trend detector and one volatility detector. Optional layers add macro or credit-spread context.
Trend detectors
SMA(50) and SMA(200) are the most common. A rising SMA(50) signals a short-to-medium uptrend; price above SMA(200) signals a long-term bull regime. The tradeoff is lag: a 200-period SMA reacts slowly to regime shifts, which means you may stay active too long into a downturn or re-enter too late after one.
EMA variants reduce that lag at the cost of more false signals in choppy markets. A 50-period EMA will flip direction faster than a 50-period SMA, which is useful in crypto but noisy in equities.
MACD zero-line crossover works as a trend detector when you care more about momentum direction than price level. When the MACD line crosses above zero, the short-term average has overtaken the long-term one.
Volatility detectors
ATR(14)% (ATR as a percentage of price) normalizes volatility across assets and time. Comparing current ATR% to its own 100-day moving average tells you whether volatility is elevated or suppressed relative to recent history, not just in absolute terms.
VIX serves as an implied-volatility proxy for equity strategies. A VIX reading above 25–30 historically correlates with regime stress; many systematic traders use it as a hard gate or a scaling input.
Optional detectors
A three-detector approach documented by Financial Hacker adds a credit-spread proxy, using the HYG/IEF ratio as a risk-on/risk-off signal. When credit spreads widen, the filter scores the regime as hostile even if price trend looks intact. Market breadth indicators (advance/decline lines, percent of stocks above their 200-day SMA) add a similar macro layer.
For TradingView users, two-pole trend filter scripts offer gradient coloring and sensitivity controls that make regime state visually obvious without extra calculation.
Component | Signal | Typical lookback | Main tradeoff |
SMA slope | Trend direction | 50 or 200 bars | Smooth but slow to react |
ATR% vs MA | Volatility level | 14 ATR / 100 MA | Normalized but lags spikes |
VIX level | Implied stress | Spot reading | Equity-only; no FX/crypto |
HYG/IEF ratio | Credit risk-on/off | 20–50 day trend | Requires two instruments |
Market breadth | Participation | 50–200 day | Complex to compute intraday |
Concrete formulas and parameter recommendations
The canonical rule from QuantMonitor is worth writing out explicitly:
SMA+ATR regime filter:
Trade is allowed when: SMA(50) slope > 0 AND ATR(14)% < MA(ATR(14)%, 100)
That reads as: the 50-bar trend is rising, and current volatility is below its own 100-day average. Both conditions must hold simultaneously.
Parameter recommendations by asset class:
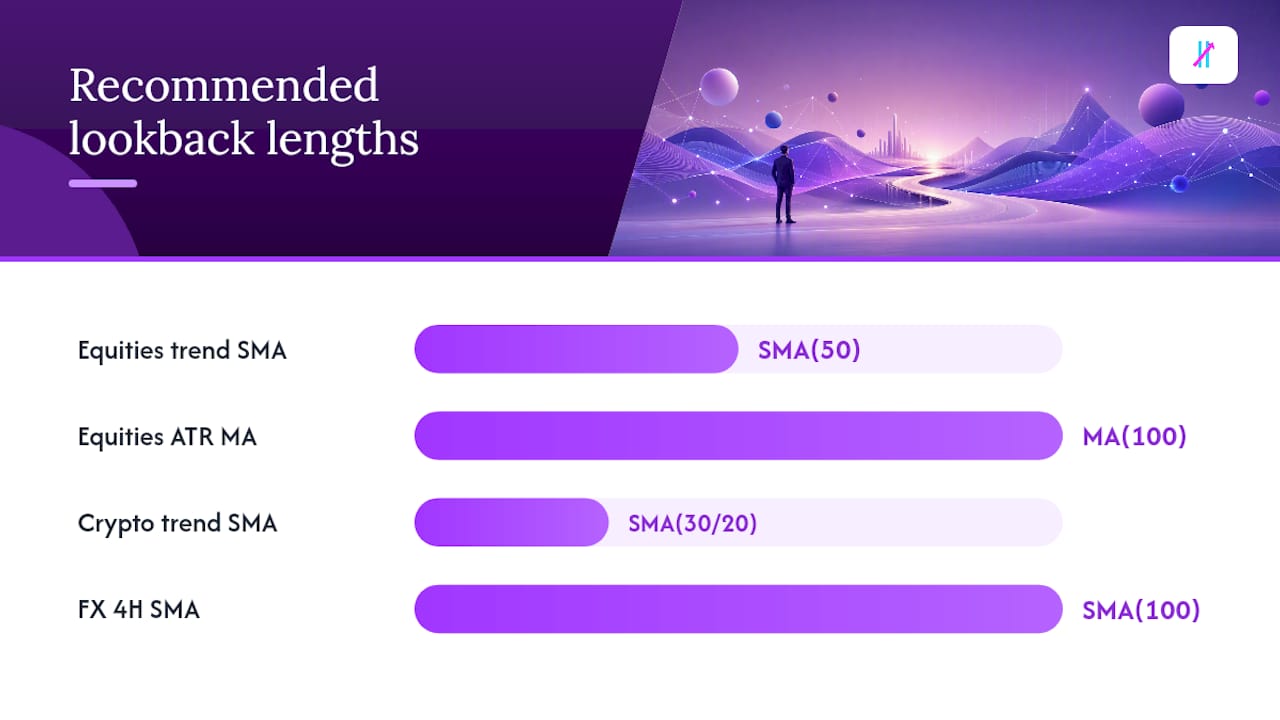
Equities (daily bars): SMA(50) slope, ATR(14)% vs MA(100). These are the defaults QuantMonitor validates. Avoid shortening the ATR MA below 60 or you get too many regime flips.
Crypto (daily bars): Shorten the trend lookback to SMA(30) or SMA(20) because crypto regimes shift faster. ATR% threshold may need to be set higher since crypto’s baseline volatility is structurally elevated.
FX (4H or daily bars): SMA(50) works on daily; on 4H, SMA(100) is more stable. ATR% comparison is still valid but consider using a 50-day MA of ATR% instead of 100.
Variants worth testing:
ADX threshold: Require ADX(14) > 20 as the trend condition instead of SMA slope. ADX measures trend strength without direction, so pair it with a directional filter (price above SMA) for long-only systems.
MACD zero-line: Replace SMA slope with MACD(12,26) > 0. Faster but noisier.
ATR percentile: Instead of comparing ATR% to its moving average, rank current ATR% against the past 252 readings. Allow trades only when ATR% is below the 60th percentile. This is more robust across different volatility regimes in the same asset.
Hysteresis and confirmation windows. A filter that flips on and off every few bars creates excessive transaction costs and whipsaw. Require the condition to hold for N consecutive bars before the regime changes. A common setting is 3–5 days for daily equity strategies. This prevents a single volatile session from shutting down a system that was otherwise healthy.
How to implement a regime filter in your system
Two patterns cover most use cases. Choose based on where in your pipeline you want the filter to act.
Pattern 1: Pre-trade binary gate
The filter runs before signal generation. If the regime is red, no signals are produced at all.
# Pseudocode — pre-trade gate
sma_slope = SMA(close, 50)[-1] - SMA(close, 50)[-6]  # 5-bar slope
atr_pct   = ATR(14)[-1] / close[-1]
atr_ma    = MA(atr_pct_series, 100)[-1]

regime_ok = (sma_slope > 0) and (atr_pct < atr_ma)

if regime_ok:
    run_strategy_signals()
else:
    pass  # no new entries
Pattern 2: Trade-time risk manager
The filter runs at order submission. Pending orders are cancelled or open positions are closed when the regime flips. QuantStart’s HMM example uses exactly this pattern: a RiskManager class intercepts orders and checks the current regime state before allowing execution.
# Pseudocode — trade-time risk manager
def on_order_event(order, regime_state):
    if regime_state == "hostile":
        cancel(order)
        close_all_positions()
    else:
        submit(order)
TradingView implementation
In Pine Script, the gate logic sits inside the entry condition:
//@version=5
strategy("Regime-Gated Strategy", overlay=true)
sma50      = ta.sma(close, 50)
sma50_prev = ta.sma(close[5], 50)
atr_pct    = ta.atr(14) / close
atr_ma     = ta.sma(atr_pct, 100)

regime_ok  = (sma50 > sma50_prev) and (atr_pct < atr_ma)

longCondition = regime_ok and ta.crossover(ta.ema(close,9), ta.ema(close,21))
if longCondition
    strategy.entry("Long", strategy.long)
For TradingView algo trading with live alerts, the regime_ok variable can gate alert conditions directly so no alert fires in a hostile regime.
Operational notes for production. If you use an HMM-based detector, serialize the trained model with Python’s pickle module and version it. Reload the exact model that was live during the period you are evaluating. Retraining cadence should match how fast regimes shift in your asset: monthly retraining works for equity daily strategies; weekly may be needed for crypto. Watch for lookahead bias when reloading models: the model must only have seen data available at the time of each historical bar.
Pro Tip: When reloading a pickled HMM in production, log the model’s training end date alongside every prediction. If a prediction was made with a model trained on future data, that bar is contaminated and must be excluded from your backtest.
What a backtest actually shows you
Apply the SMA(50)+ATR(14)% filter to a basic long-only momentum strategy on a liquid equity index and you will typically see this pattern:
Active trading days: Drops materially. The filter keeps the system out of bear markets and high-volatility chop, which can represent 30–40% of calendar time in a full market cycle.
Total trades: Fewer, sometimes by half. This is not a problem unless it drops below the threshold where statistical inference becomes unreliable (roughly 30 trades minimum for basic significance).
Max drawdown: Reduced. QuantStart’s HMM-based example cut maximum daily drawdown from approximately 56% to approximately 24%. A simpler SMA+ATR filter produces a smaller but still meaningful improvement.
CAGR: Usually a modest reduction or roughly flat. You give up some upside by sitting out early-stage recoveries.
Sharpe ratio: Often improves because drawdown shrinks faster than returns do.
Expectancy per trade: Tends to rise. Filtering out hostile regimes removes the worst-performing trades disproportionately.
You need enough trades in each regime bucket to trust the statistics. If the filtered strategy has fewer than 30 trades in the out-of-sample period, the results are not statistically meaningful regardless of how good the Sharpe looks.
Testing and validation: how to trust your filter
A regime filter has its own parameters (lookback, threshold, confirmation window) that can be overfit just like any other model parameter. The testing workflow needs to be stricter than for a simple indicator.
Split your data before touching parameters. Reserve at least 30% of your historical data as a hold-out set. Never look at it until your filter parameters are finalized on the in-sample period.
Avoid lookahead bias. The SMA(50) at bar T must use only data through bar T. This sounds obvious but is easy to violate when computing rolling ATR% moving averages in vectorized backtesting libraries.
Model transaction costs and slippage. A filter that flips frequently generates extra round-trip costs. Include realistic commissions and at least one tick of slippage per trade.
Walk-forward validation. Divide the in-sample period into rolling windows. Train on the first window, test on the next, slide forward, repeat. If filter performance degrades consistently in the test windows, the parameters are overfit.
Sensitivity scan. Shift each parameter by ±20% and rerun. If Sharpe collapses when SMA lookback moves from 50 to 40 or 60, the filter is fragile. A robust filter should show gradual, monotonic degradation rather than a cliff edge.
Investopedia’s five-step trade test enforces a similar confluence discipline at the individual trade level: trend, volume, volatility, a clear trigger, and a predefined stop/target must all align before entry. Applying that logic to regime-level decisions means requiring multiple detectors to agree before calling a regime favorable.
Pro Tip: After filtering, count the trades per regime bucket. If one bucket has fewer than 15 trades in your test period, run a bootstrap sign test rather than relying on Sharpe alone. Small samples make Sharpe look better than it is.
When regime filters hurt you
Filters fail in predictable ways. Knowing the failure modes in advance lets you build in mitigations before they cost you real money.
Regime misclassification: The filter calls a volatile uptrend hostile and keeps you out of a strong rally. SMA-based detectors are especially prone to this during sharp V-shaped recoveries.
Over-filtering: Too many conditions, too tight thresholds. The system trades 12 times a year and the statistics are meaningless.
Delayed reaction: A 50-bar SMA takes weeks to confirm a new trend. You re-enter after the best part of the move is over.
Flip-flopping: Without a confirmation window, the filter toggles on and off every few bars, generating transaction costs that erase the benefit.
Event risk: The filter shows green the morning of a major Fed announcement. The regime was calm; the announcement was not.
Mitigations:
Add a hysteresis window (3–5 bars) so the regime must hold its new state before the filter acts.
Use partial exposure scaling instead of a binary gate. Half size in a borderline regime preserves some upside while reducing risk.
Combine at least two independent detectors (trend + volatility, or trend + credit spread). A single detector is easy to fool.
Maintain an event blackout calendar. No new entries within 24 hours of scheduled high-impact announcements (FOMC, CPI, NFP). FXStreet’s operational checklist lists major announcements as a standalone reason to stand aside, separate from any indicator reading.
For strategies that require continuous exposure (carry trades, volatility selling), a hard binary gate is usually wrong. Use scaling instead.
A 5-step framework for deploying a filter safely
Before going live, work through these steps in order. Skipping step 3 or 4 is where most traders get burned.
Step | Action | Acceptance threshold |
1. Assess fit | Check if your strategy’s drawdowns cluster in specific regimes | Drawdown concentration > 60% in one regime type |
2. Define detectors | Choose trend + volatility inputs; add credit/breadth if needed | At least 2 independent detectors |
3. Simulate impact | Run in-sample backtest with and without filter | Sharpe improves; trade count stays above 30 |
4. Walk-forward test | Roll through out-of-sample windows; check parameter stability | Consistent improvement across 3+ test windows |
5. Staged rollout | Paper trade for 4 weeks; monitor live vs expected metrics | Drawdown alert if live DD exceeds 1.5× backtest DD |
Monitoring KPIs in production: Track realized drawdown vs backtest drawdown weekly. Watch trade count per month against the historical average. If the filter is blocking 3× more trades than expected, the regime detector may have drifted or a data feed issue is generating false signals. Set a rollback trigger: if live max drawdown exceeds 1.5 times the backtest figure within the first 90 days, revert to the unfiltered strategy and re-examine.
The Expectation-Maximization algorithm is the standard fitting method for HMM-based regime detectors. If you use one, retrain on a rolling window and compare the new model’s regime classifications against the previous version before deploying. A sudden shift in regime labels is a signal to investigate, not to deploy automatically.
For a structured systematic trading framework that shows where regime filters sit inside a full strategy pipeline, the implementation context matters as much as the filter logic itself.
A practitioner’s perspective on regime filters
The most common mistake I see is treating a regime filter as a performance enhancer. It is not. It is a loss-reduction tool. If your base strategy has no edge, filtering regimes will not create one. It will just give you fewer losing trades and fewer winning ones, and the ratio may not improve.
The second mistake is over-engineering the detector. A two-condition SMA+ATR filter, applied consistently with a confirmation window, outperforms elaborate multi-detector systems in most retail backtests because it has fewer parameters to overfit. The Financial Hacker’s three-detector approach is worth studying, but it requires more data to validate and more discipline to maintain.
What actually works in practice: pick one trend detector and one volatility detector, require both to agree, add a 3–5 bar confirmation window, and test it on at least five years of daily data with a clean out-of-sample split. If it passes that test, it is worth deploying at reduced size. If it does not, no amount of parameter tuning will fix it.
The operational piece that gets underestimated is retrain cadence. A regime model trained in 2020 may misclassify 2024 conditions because the volatility baseline has shifted. Monthly retraining on a rolling 3-year window is a reasonable default for equity daily strategies. For crypto, shorten that to weekly or biweekly.
Big Move Algo’s built-in Fake Trend Detector addresses the misclassification problem directly by flagging low-quality or misleading market conditions before a signal fires. For traders who want regime awareness without building a custom detector, that kind of signal calculation logic embedded in the indicator itself is a meaningful operational shortcut.

Big Move Algo gives you regime-aware signals without the build time
Traders who want the benefits of a regime filter without coding one from scratch have a direct path: Big Move Algo is a TradingView indicator that delivers Long, Short, and Exit signals with a built-in Fake Trend Detector that flags hostile or misleading market conditions before a signal fires.

AUTO Mode requires minimal setup and works across crypto, forex, stocks, indices, and commodities. Manual Mode lets you adjust sensitivity for your specific asset and timeframe. Alerts route to your phone, email, or automation platform, so the regime gate works even when you are not watching the chart. For traders building toward automated trading income, Big Move Algo’s alert integration connects directly to execution platforms without extra middleware.
Start with a trial in Manual Mode on your primary market. Test the Fake Trend Detector against the SMA+ATR logic you have been reading about, and see how the signal count and quality compare on your own historical data. Visit Bigmovealgo to review the subscription plans and get instant access after payment.
Sources
This article is general information, not a substitute for advice from a qualified financial advisor. Consult a qualified financial professional about your own circumstances before acting on anything here.
Recommended
Comments