
How to Read Buy and Sell Signals as a Beginner Trader


A usable trading signal is a five-part instruction: direction (long or short), a specific entry rule, a stop-loss, a take-profit, and the timeframe it applies to, plus a rationale explaining why the setup exists at all. If any of those pieces is missing, what you have is a guess dressed up as advice, not a signal you can actually trade.
The one rule every beginner needs before touching a signal: confirm the higher-timeframe trend, require at least one other form of confluence (a level, volume, or momentum agreeing with the trigger), and always set a stop-loss before you set anything else. Skip that sequence and you are gambling with extra steps.
Before you act on any alert, run through this:
Check the trend on a timeframe higher than the one that generated the signal.
Set your stop-loss the moment you enter, not after.
Calculate position size from your risk percentage, not from how confident you feel.
Pro Tip: If a signal provider or indicator can’t tell you the stop-loss and timeframe in the same breath as the entry, treat it as an opinion, not a signal. Tools like Big Move Algo build this structure in directly, labeling alerts as Long, Short, or Exit so the direction and action are never ambiguous.
Key Takeaways
A trading signal only becomes usable once it specifies direction, entry, stop-loss, take-profit, timeframe, and rationale, and beginners should never act on one until trend and confluence confirm it.
Point | Details |
Six fields define a signal | Direction, entry, stop-loss, take-profit, timeframe, and rationale must all be present. |
Confirm before you act | Check higher-timeframe trend, trigger confirmation, and volume before entering any trade. |
Use the confluence scorecard | Score trend, level, trigger, volume, and R:R; a score of 4 or 5 supports full size. |
Risk small, require good R:R | Risk 0.5% to 1% per trade and demand a minimum 1.5 to 2 reward-to-risk ratio. |
Big Move Algo simplifies the read | Labels signals as Long, Short, or Exit and filters weak setups with its Fake Trend Detector in AUTO or Manual mode. |
Table of Contents
What a Complete Buy or Sell Signal Actually Includes
Most beginners learn to read direction and stop there. That is half a signal. A complete trading signal needs six fields working together, and missing even one turns a plan into a coin flip.
Direction — long or short, stated plainly, not implied by an arrow color you have to guess at.
Entry — a specific price or a defined trigger condition, such as “buy on close above resistance,” not a vague zone.
Stop-loss — the exact price where the idea is proven wrong and you exit, no exceptions.
Take-profit — one or two price targets based on prior structure, not a round number picked for comfort.
Timeframe — the chart interval the signal applies to; a 15-minute signal and a daily signal are different animals.
Rationale — the reason the setup exists: a trendline break, a moving average cross, a volume spike.
Here is the difference in practice. A complete signal reads: “Long EUR/USD at 1.0850 on the 4-hour close above resistance, stop at 1.0800, target 1.0950, based on trend continuation after a retest.” A poor signal reads: “Buy EUR/USD now, looks bullish.” The second version gives you no way to size your risk, no invalidation point, and no idea whether it still applies in an hour.
Missing fields do not just create confusion. They create execution ambiguity, meaning two traders acting on the “same” signal end up with wildly different entries, risk, and outcomes. That is the opposite of what a signal is supposed to do.
The Main Types of Trading Signals and What They Measure
Signals fall into a handful of families, and knowing which one you are looking at tells you what question it actually answers.
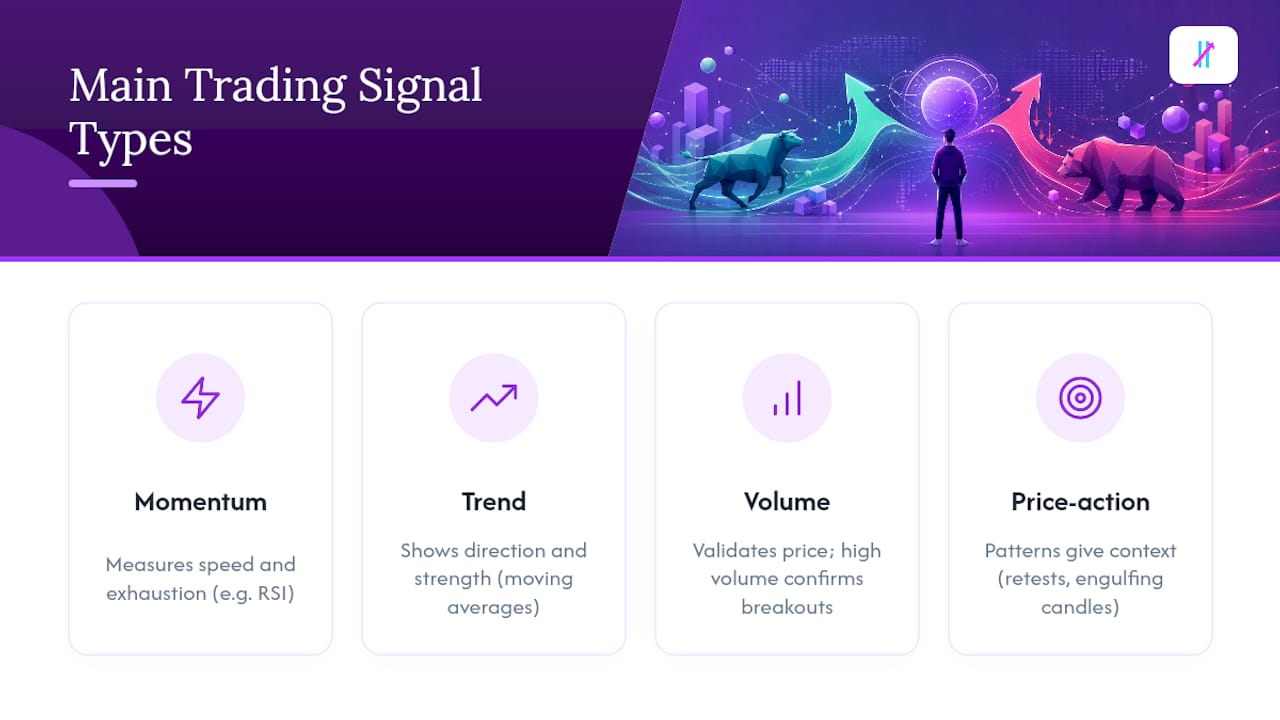
Momentum indicators like RSI and Stochastic measure speed and exhaustion, not direction. An RSI reading above 70 suggests overbought conditions, but in a strong trend it can stay overbought for weeks. Divergence, where price makes a new high but RSI does not, is a more reliable warning than the raw overbought/oversold line alone.
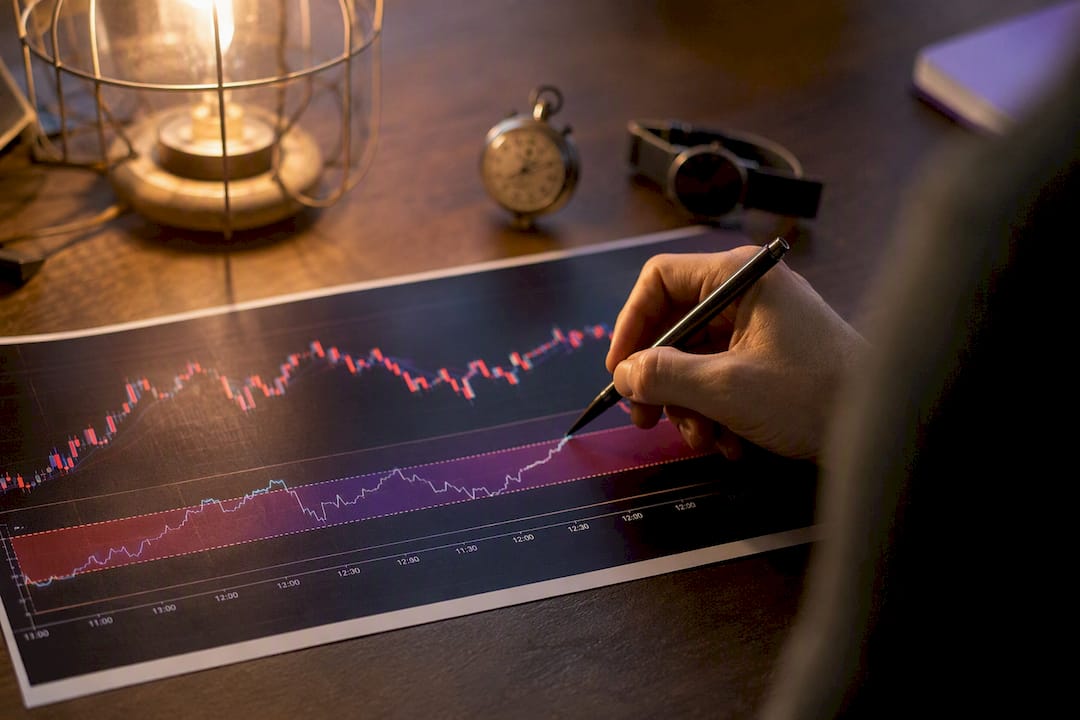
Trend indicators such as moving averages, MACD, and Supertrend describe the direction and strength of the prevailing move. A moving average crossover works best when it agrees with the higher-timeframe bias; the same crossover against that bias produces far more false signals.
Volume-based signals like VWAP and OBV validate what price is doing. A breakout on light volume is a warning sign, not a confirmation, since volume increases on genuine breakouts while low-volume moves tend to fail and reverse.
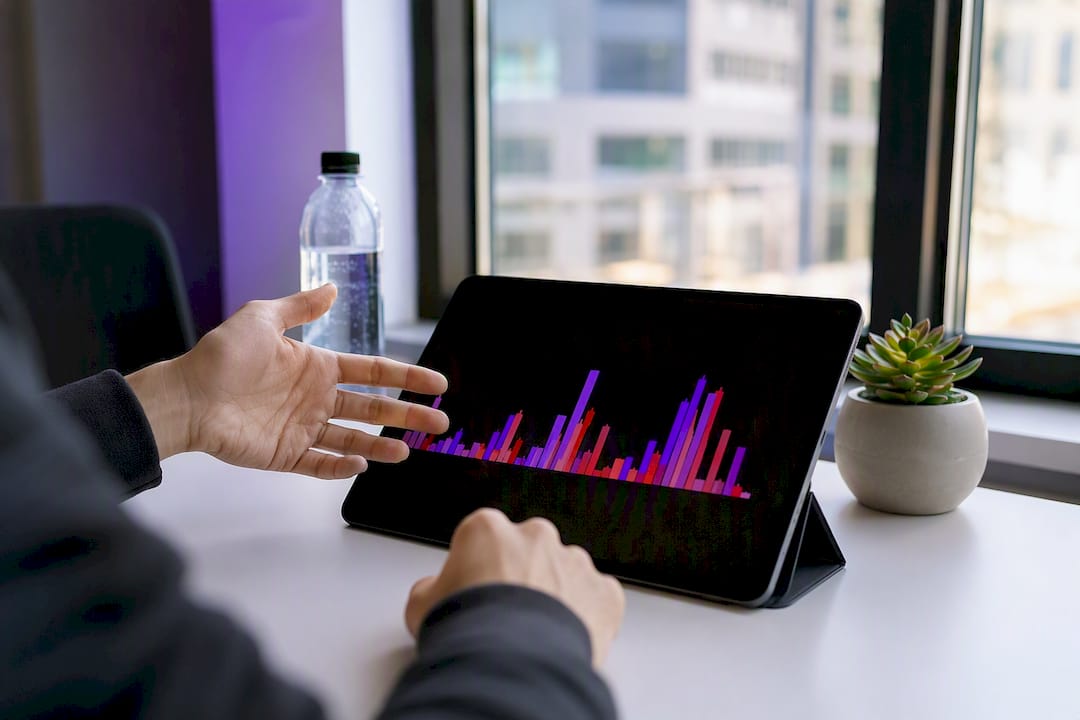
Price-action and candlestick patterns such as breakout-and-retest, engulfing candles, and double tops give you context that indicators alone miss. A single engulfing candle at a random point on the chart means little; the same candle at a tested support level means a great deal.
Algorithmic alerts automate the scanning across all of these at once, which is genuinely useful. But automation should speed up your search for setups, not replace the validation step. Every alert an algorithm generates still needs a human check of trend, volume, and market context before you act on it.
The 6-Step Workflow to Validate Any Signal Before You Trade It
An alert is a candidate, not a command. Here is the sequence that turns a raw signal into a decision you can defend, in order, every single time.
Establish higher-timeframe bias. Look one or two timeframes above the one that produced the signal. If your entry signal fires on the 15-minute chart, check the 4-hour and daily trend first. Trading with that bias dramatically improves your odds; trading against it means you need a much stronger reason to proceed.
Confirm the trigger actually happened. Did the candle close beyond the level, or is price just wicking through it? A crossover that has not confirmed on a closed candle is not a signal yet, it is a possibility.
Check volume and liquidity. A breakout with volume well above the recent average carries far more weight than one that limps through on thin participation. This is one of the simplest filters available and one of the most skipped.
Check session and news context. Is a major economic release due in the next hour? Is it a low-liquidity session like the Asian open for a pair that trades mostly in London and New York hours? High-impact events can invalidate a perfectly good technical setup in seconds.
Calculate your stop size and position size. Decide your risk in dollars first (a fixed percentage of your account), then work backward to figure out how many units or contracts that allows given your stop distance. Never size the trade first and see what the risk turns out to be.
Run the confluence scorecard. Score the setup across five dimensions: trend alignment, a real support/resistance level, a confirmed trigger, supporting volume, and a favorable risk-to-reward ratio. A simple 0-to-5 scorecard works well here: a score of 2 or below means skip, 3 means proceed cautiously with reduced size, and 4 or 5 means the setup deserves your standard position size.
Pro Tip: Write your scorecard number down before you enter, not after. Traders who score retroactively almost always find a way to justify the trade they already wanted to take.
Decision rules follow naturally from the score: take the trade at full size when confluence is strong, scale down size when it is moderate, and walk away when the alert only satisfies one or two dimensions, as explained in the Volatility Breakout Strategy: Rules, Automation and Edge. That last option, doing nothing, is a valid and often profitable decision.
Beginner Mistakes That Wreck Accounts and How to Avoid Them
The costliest mistakes in trading are boring, repetitive, and entirely avoidable. Here is what actually drains beginner accounts.
Following signals blindly without checking whether the trend, volume, or news backdrop supports them.
Trading without a stop-loss, often because the trader is “sure” the price will bounce back.
Overleveraging a small account to chase bigger dollar returns from small percentage moves.
Ignoring spread and slippage, especially on lower-liquidity pairs or after-hours sessions, which quietly erodes the edge a signal appeared to offer.
Chasing alerts after the move has already happened, entering late and buying the top of the very breakout the signal was meant to catch.
The fix is a small set of rules applied consistently. Risk 0.5% to 1% of your account per trade, not 5%. Require a minimum reward-to-risk ratio of 1.5 to 2 before you consider a setup worth taking. Prefer limit orders placed at your planned level over market orders chasing price, and widen your stop in genuinely low-liquidity markets rather than getting stopped out by noise.
Trade management matters as much as entry. Moving your stop to breakeven once a trade reaches a set profit level protects capital without fully exiting a winner. Taking partial profits at a first target while letting the rest run is a documented way to capture larger moves while locking in gains. And keep a journal. A string of three or more losses in a row is your cue to shrink size and review your process, not to double down.
A Copyable Signal Template You Can Use Today
Here is a template worth saving and reusing on every trade idea, whether it comes from an indicator, a chart pattern, or your own read of the market.
Before entering, run your six-item pre-trade checklist: trend confirmed on the higher timeframe, trigger candle closed (not just wicked), volume above average, no major news event in the next hour, stop-loss and take-profit both set, and position size calculated from your risk percentage.
Applied end to end: price breaks a resistance level on the 4-hour chart, pulls back to retest it, and closes back above it on rising volume with the daily trend still pointing up. That satisfies trend, trigger, and volume simultaneously. You calculate your stop distance at 50 pips, decide you’re risking 0.75% of your account, size the position accordingly, and set both targets before you click confirm. That is the entire process, and it takes less time to execute than it does to read.
How Big Move Algo Structures Signals for Beginners
Signal clarity is the whole point of building a tool like Big Move Algo. Instead of forcing you to interpret raw indicator readings, it labels conditions directly as Long, Short, or Exit, so direction is never something you have to infer from a crossing line.
The built-in Fake Trend Detector exists specifically to catch the scenario that wrecks beginner accounts most often: choppy, low-conviction price action that looks like a trend but isn’t. It flags those conditions so you can sit out rather than force a trade.
AUTO Mode suits rapid scanning across multiple charts with minimal setup, ideal when you’re still building screen-time experience.
Manual Mode gives more experienced users room to customize inputs and layer in their own validation criteria.
Either way, the same discipline applies. Automated alerts still need the same human checks that any manual signal requires.
An alert is not permission to skip your process. It’s a starting point for the six-step workflow, the same as any signal from any source.
Signals Are Aids, Not Commands
The biggest mistake I see beginners make isn’t picking a bad indicator. It’s outsourcing judgment entirely to whatever flashed on their screen. A signal, however well built, only ever narrows the odds in your favor. It doesn’t replace the verification work of checking trend, volume, and context for yourself.
Trust the process more than any single alert. Log every trade, win or lose, with the reasoning attached. Trade small while you build that habit, and let your position size grow only as your review cycles prove the process actually works for you.
Ready to Trade With Clearer Signals?
If you’ve made it this far, you already know that reading signals well is mostly about discipline: checking trend, confirming volume, and never skipping the stop-loss. Big Move Algo builds that discipline into the tool itself. Instead of parsing five indicators at once, you get a single clear Long, Short, or Exit label, backed by the Fake Trend Detector that filters out the choppy conditions where most beginner losses happen.

It suits traders who want structure without complexity: AUTO Mode for fast, low-setup scanning across crypto, forex, stocks, indices, or commodities, and Manual Mode for those ready to add their own validation layer. Subscriptions unlock instant access after checkout, with unlimited devices and alerts delivered to the platforms you already use. If you’re ready to see it on your own charts, connect your TradingView account and start applying the same six-step workflow to signals built for clarity from the ground up.
Frequently Asked Questions
What is the easiest way for a beginner to start reading buy and sell signals? Start by checking whether the signal states all six required fields: direction, entry, stop-loss, take-profit, timeframe, and rationale. If any are missing, treat it as incomplete information rather than a trade to take.
Do I need to understand every indicator to read signals well? No. Understanding one momentum tool, one trend tool, and how volume confirms a breakout covers most of what beginners need. Depth in a few tools beats shallow familiarity with a dozen.
How much of my account should I risk on one signal? Most experienced traders cap risk at 0.5% to 1% per trade, regardless of how confident the signal looks. That keeps a string of losses from doing serious account damage.
Can automated tools like Big Move Algo replace manual signal reading entirely? Automation speeds up scanning and removes a lot of guesswork, but running your own trend and volume check on any alert, automated or not, remains part of responsible trading.
Sources
Recommended
Comments