
What Is a Buy Signal in Trading? A Retail Trader's Guide
- Steven Hartwell

- Jun 22
- 7 min read

A buy signal is defined as a rule-based trigger that alerts a trader to enter a long position in a financial asset. It removes guesswork from entry decisions by applying preset criteria to price data, volume, or fundamental metrics. Understanding what is a buy signal in trading is the foundation of any structured trading strategy. Retail traders who rely on clear signals instead of gut instinct make more consistent decisions. Tools like moving averages, the Relative Strength Index (RSI), and MACD crossovers are among the most widely used buy signal indicators across stocks, crypto, forex, and commodities.
What is a buy signal in trading, and how does it work?
A buy signal is an objective trigger generated by technical indicators, algorithms, or fundamental data that marks a favorable moment to enter a trade. The core purpose is to replace emotional decision-making with a defined, repeatable process. Instead of asking “does this feel right?”, a trader asks “does this meet my criteria?”
Buy signals operate on logic. A condition is set in advance, and when the market meets that condition, the signal fires. This structure keeps traders disciplined during volatile sessions when fear and greed are loudest. The buy signal definition, at its simplest, is a pre-agreed rule that says: the conditions for buying are now met.

Retail traders access these signals through charting platforms like TradingView, dedicated signal services, or proprietary indicators. The signal itself is only as reliable as the logic behind it, which is why understanding the types and their limitations matters before putting real capital at risk.
What are the most common types of buy signals?
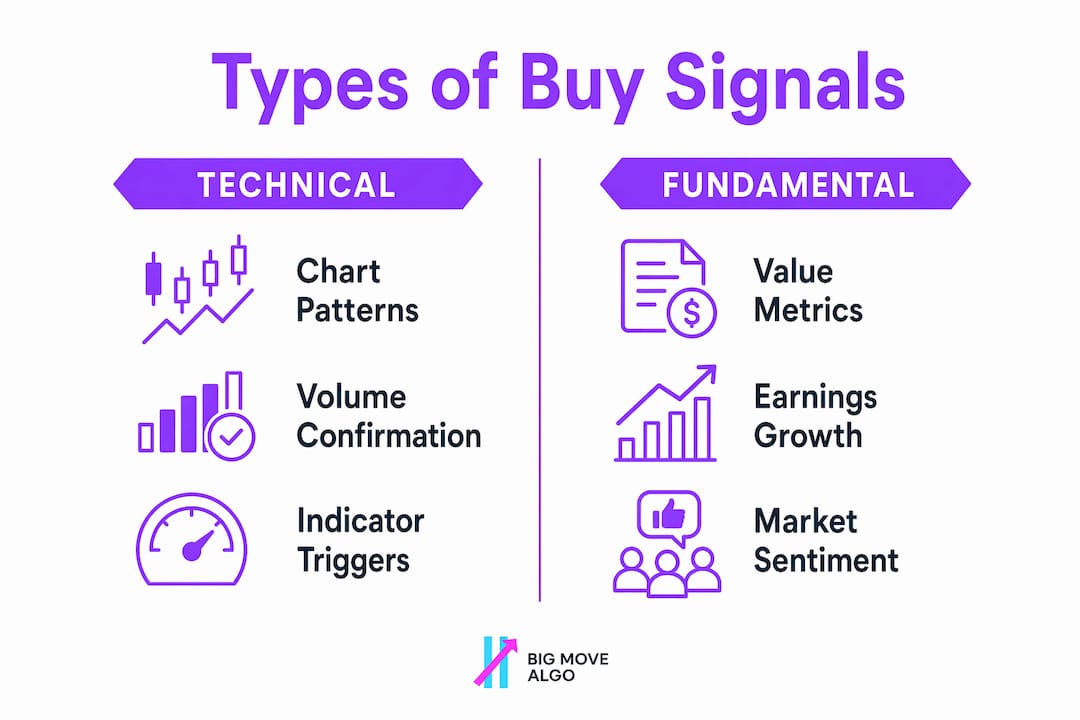
Buy signals fall into three broad categories: technical, chart pattern based, and fundamental. Each type suits different trading styles and timeframes.
Technical buy signals are the most widely used by retail traders:
Golden Cross: The 50-day moving average crosses above the 200-day moving average. This signals a potential long-term trend shift to the upside.
RSI below 30: The RSI oversold reading below 30 suggests the asset is oversold and may be due for a reversal.
MACD crossover: The MACD line crosses above the signal line, indicating upward momentum is building.
Volume breakout: Volume increases during a price breakout confirm that buying interest is genuine, not a false move.
Chart pattern buy signals are visual formations that traders recognize as precursors to upward moves. A double bottom forms when price tests a support level twice and bounces, signaling buyers are defending that level. An inverse head and shoulders pattern suggests a bearish trend is reversing. A breakout above a resistance level, especially on high volume, is one of the most reliable chart-based buy signals.
Fundamental buy signals apply more to investors than short-term traders. A stock trading below its book value, a price-to-earnings ratio significantly lower than its sector average, or a positive earnings surprise can all trigger a buy decision based on valuation logic rather than price action.
Pro Tip: Volume is the most underused confirmation tool. A technical signal without volume backing is a hypothesis. A technical signal with strong volume is a conviction.
How do traders confirm and validate buy signals?
Relying on a single indicator is the most common mistake retail traders make. Multiple non-correlated indicators working together raise signal quality significantly. A momentum indicator, a trend indicator, and a volume indicator each measure different aspects of market behavior. When all three align, the signal carries far more weight.
Here is a practical confirmation process:
Identify the primary signal. A golden cross fires on the daily chart. This is your initial trigger.
Check momentum. Is the RSI rising and above 50? A golden cross combined with rising RSI confirms both trend reversal and momentum buildup.
Confirm with volume. Is volume above its 20-day average on the breakout candle? Strong volume removes doubt about market consensus.
Apply a stop-loss. No buy signal guarantees profit. Set a stop-loss below the most recent swing low before entering. This limits downside if the signal fails.
Backtest the setup. Before trading a new signal combination live, run it against 3–5 years of historical data to estimate its win rate. Backtesting separates viable edges from random noise.
The confirmation process does not need to be complex. Three aligned indicators with a defined stop-loss is a complete system for most retail traders. Adding more conditions beyond that often reduces adaptability without improving accuracy.
Pro Tip: Test your signal rules on a demo account for at least 30 trades before going live. Thirty trades gives you a statistically meaningful sample to evaluate performance.
Algorithmic vs. manual buy signals: what is the difference?
Algorithmic buy signals automate entry triggers based on strict, pre-coded logic. Manual signals require a trader to interpret charts and decide when conditions are met. Both approaches have clear tradeoffs.
Feature | Algorithmic signals | Manual signals |
Emotion | Removed entirely | Subject to bias and hesitation |
Speed | Instant execution | Delayed by human reaction |
Backtesting | Built into the process | Requires manual review |
Flexibility | Limited by coded rules | Adapts to context in real time |
Overfitting risk | High with complex systems | Lower, but inconsistency is common |
Algorithmic signals enforce discipline by removing the emotional component entirely. A trader who codes a golden cross rule will execute every golden cross, not just the ones that feel comfortable. This consistency is the primary advantage of rule-based systems.
The limitation is overfitting. Complex signals requiring many simultaneous conditions often fail in live markets because they were tuned too tightly to historical data. A signal that worked perfectly on five years of past data may break down when market conditions shift. Simpler systems with fewer conditions tend to hold up better over time.
Retail traders can access automated signal generation through TradingView indicators, dedicated platforms, and proprietary tools without needing to write code themselves. The key is choosing a system with transparent logic and a verifiable track record.
How to identify and use buy signals effectively in 2026
Applying buy signals well requires more than knowing what they are. The following practices separate traders who use signals profitably from those who chase every trigger.
Choose indicators that match your timeframe. A daily golden cross is irrelevant for a 15-minute scalping strategy. Match signal logic to the chart you trade.
Always trade with trend context. A buy signal in a strong downtrend is a counter-trend bet. The same signal in an established uptrend is a continuation trade. Context changes the probability.
Use technical indicators for timing entries, not for predicting direction. Signals tell you when conditions are met, not where the market will go.
Keep a trading journal. Log every signal you act on, the confirmation criteria you used, and the outcome. Patterns in your journal reveal which setups work for your style.
Avoid stacking too many indicators. Four indicators measuring the same thing (all momentum, for example) do not confirm each other. They just repeat the same information with extra noise.
Integrate risk management from the start. A buy signal without a stop-loss is incomplete. Define your exit before you enter.
The traders who use buy signals most effectively treat them as probability tools, not certainties. Each signal raises the odds of a successful trade. It does not guarantee one.
Key Takeaways
A buy signal is a rule-based trigger that improves entry timing by replacing emotional decisions with defined, testable criteria across technical, chart pattern, and fundamental analysis.
Point | Details |
Buy signal definition | A rule-based trigger marking favorable conditions to enter a long position. |
Confirmation matters | Combining momentum, trend, and volume indicators raises signal reliability. |
Backtesting is required | Test signal rules against 3–5 years of historical data before trading live. |
Risk management is non-negotiable | Every buy signal needs a pre-defined stop-loss to limit downside. |
Simplicity outperforms complexity | Fewer conditions in a signal system improve adaptability to changing markets. |
Why I think most traders misuse buy signals
Most retail traders treat buy signals as instructions. They see a golden cross fire and they buy, full stop. That is the wrong mental model. A buy signal is a prompt to evaluate, not a command to execute.
The traders I have seen succeed long-term treat every signal as the start of a checklist, not the end of one. They ask: does the trend support this? Is volume confirming? Where is my stop? Only when those questions have satisfying answers do they act. That process takes 60 seconds. It filters out a significant portion of losing trades.
The other mistake I see constantly is signal hopping. A trader uses RSI for two weeks, gets a few losses, and switches to MACD. Then Bollinger Bands. Then something else. No system gets a fair test. Mechanical signals remove emotional bias precisely because they enforce consistency. You cannot benefit from consistency if you abandon the system after five trades.
My honest advice: pick two or three non-correlated indicators, define your entry and exit rules in writing, and backtest them. Then trade that system for at least 50 live trades before judging it. The discomfort of sticking to a system through drawdowns is where discipline is actually built.
— Steven Hartwell
Big Move Algo: clear signals for retail traders
Knowing what triggers a buy signal is one thing. Having a tool that identifies those signals in real time, across multiple markets, is another.

Big Move Algo is a TradingView indicator that delivers Long, Short, and Exit signals based on real-time market analysis. It works across crypto, forex, stocks, indices, and commodities. The built-in Fake Trend Detector filters out low-quality market conditions, so traders only see signals worth acting on. AUTO Mode gets you trading with minimal setup, while Manual Mode gives experienced traders additional control. Big Move Algo reports up to 92% win rate signals across its supported markets. If you want structured, rule-based entries without building your own system from scratch, it is worth a look.
FAQ
What is the buy signal definition in simple terms?
A buy signal is a rule-based condition that tells a trader the market meets the criteria to enter a long position. It is generated by technical indicators, algorithms, or fundamental data.
How do I identify buy signals on a chart?
Look for technical events like an RSI reading below 30, a golden cross, or a MACD crossover, then confirm with rising volume. Multiple aligned signals carry more weight than any single indicator.
What triggers a buy signal in algorithmic trading?
An algorithmic buy signal fires when pre-coded conditions are met in the market data, such as a moving average crossover or a price breakout above resistance. The system executes without human interpretation.
Are buy signals reliable?
Buy signals are probabilistic, not guaranteed. All signals carry risk, which is why every signal should be paired with a stop-loss and confirmed by multiple indicators before acting.
What is the difference between a buy signal and a sell signal?
A buy signal marks conditions favorable for entering a long position. A sell signal marks conditions favorable for exiting that position or entering a short. Both are generated by the same types of indicators applied to different market conditions.
Recommended
Comments